VMD-L Mailing List
From: Nifeng Guo hui (nifenggaohui_at_gmail.com)
Date: Sun Nov 02 2014 - 22:19:43 CST
- Next message: Axel Kohlmeyer: "Re: Fwd: namd-l: Why RDF increases as r increase instead of constant"
- Previous message: Tim Lo: "Re: Fwd: namd-l: Why RDF increases as r increase instead of constant"
- In reply to: Tim Lo: "Re: Fwd: namd-l: Why RDF increases as r increase instead of constant"
- Next in thread: Axel Kohlmeyer: "Re: Fwd: namd-l: Why RDF increases as r increase instead of constant"
- Reply: Axel Kohlmeyer: "Re: Fwd: namd-l: Why RDF increases as r increase instead of constant"
- Messages sorted by: [ date ] [ thread ] [ subject ] [ author ] [ attachment ]
Hi Tim,
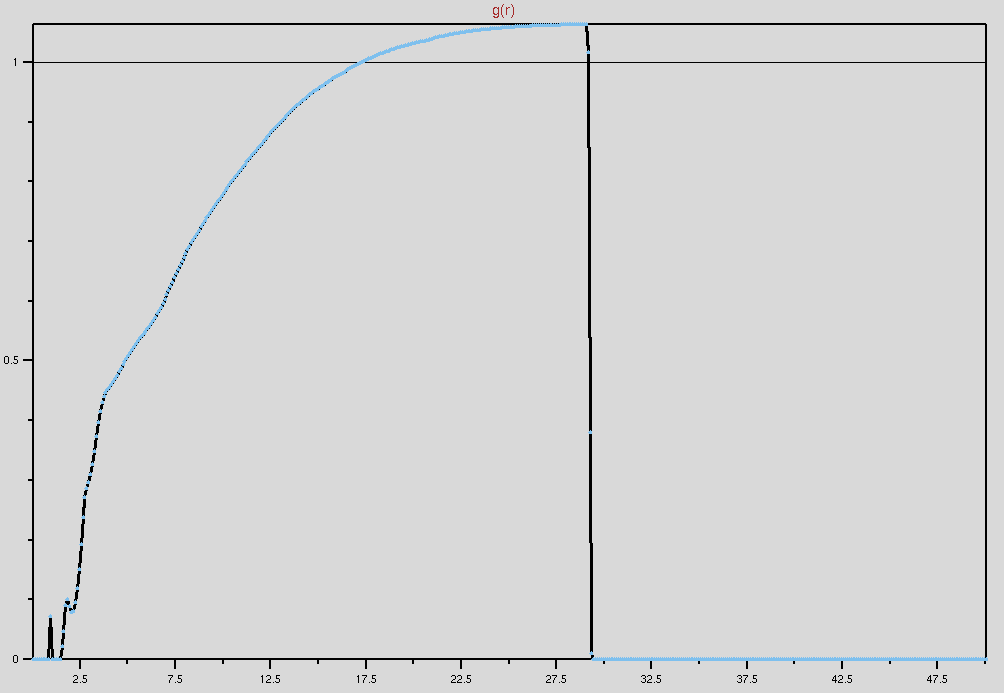
Thanks for the explanation. Now I follow your instruction and plot it
again. It still does not make sense. I use period boundary condition to
simulate in a cubic box with dimension 50. The molecule size is
cellBasisVector1 48.12900161743164 0 0
cellBasisVector2 0 42.979000091552734 0
cellBasisVector3 0 0 43.9109992980957
cellOrigin 0.5063787698745728 1.1608952283859253 0.11323882639408112.
Please find the picture in the attachment. Thanks.
Peng
2014-11-02 19:19 GMT-06:00 Tim Lo <timlo_at_hku.hk>:
> Hi Peng,
>
> By looking at the r-axis, the graph just displays g(r) for the range of
> [0, 10]. You should increase "max r" to your desired value, but not just
> use the default value of 10.0.
>
> Tim
>
>
> On 2014/11/3 上午 06:01, Nifeng Guo hui wrote:
>
>> Dear VMD users,
>> We perform one simulation with one protein immersed in water. Now, we
>> want to analyze the water distribution around this molecule after finishing
>> production run. The g(r) GUI Plugin, Version 1.3 was applied to calculate
>> its function. After I input PSF and DCD files, I put "residue 1 to 36" in
>> Section 1 and "water" in Section 2. (This protein is composed of 36 amino
>> acids. ) I also tried "protein" for Selection 1. Next, Frames are "0" in
>> First and "19999" in Last. Then before using compute g(r), I select Use
>> PBC, Display g(r), and Display int(g(r)). However, the result does not
>> reach our predictions. The RDF and Coordination number are both increasing
>> exponentially as r increase. In our prediction, it supposes to become
>> constant. Could you help me find what cause this? Plese also take a look
>> at the plot in the attachment. Thanks.
>> Peng
>>
>>
>>
>>
>
- Next message: Axel Kohlmeyer: "Re: Fwd: namd-l: Why RDF increases as r increase instead of constant"
- Previous message: Tim Lo: "Re: Fwd: namd-l: Why RDF increases as r increase instead of constant"
- In reply to: Tim Lo: "Re: Fwd: namd-l: Why RDF increases as r increase instead of constant"
- Next in thread: Axel Kohlmeyer: "Re: Fwd: namd-l: Why RDF increases as r increase instead of constant"
- Reply: Axel Kohlmeyer: "Re: Fwd: namd-l: Why RDF increases as r increase instead of constant"
- Messages sorted by: [ date ] [ thread ] [ subject ] [ author ] [ attachment ]


