Molecular Dynamics Flexible Fitting
MDFF method
- Incorporating EM data into simulation
- Preventing overfitting
- Validation: Crystal structures of the same biomolecule captured in two conformational states
- Application: The bacterial ribosome
- Symmetry-restrained MDFF for symmetric EM data
- xMDFF: MDFF for low-resolution X-ray Crystallography
- xMDFF Application 1: Refinement and experimental validation of a voltage-sensor domain
- xMDFF Application 2: Refinement of Small-Molecules
Incorporating EM data into simulation
|
|
|
|
Volume slice of a 6.7-Angstrom EM map of the ribosome. The arrows show the gradient of the external field that directs the structure into the density. |
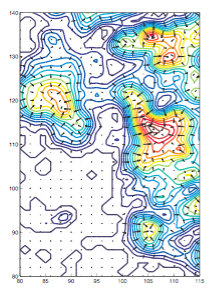
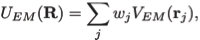
where
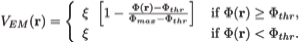
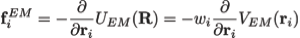
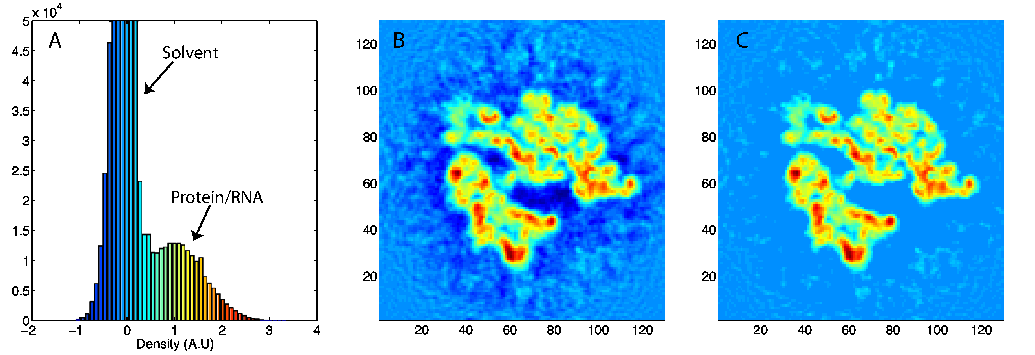
Here wj corresponds to a per-atom weigh, typically set to the atomic mass, ξ is a force scaling, Φ(r) is the EM density at position r, Φmax is the maximum value of the EM density map, and Φthr is a density threshold. The purpose of the density threshold is to remove from the EM data the solvent contribution (see figure below). An atom placed in this external potential feels a force of
|
|
|
|
(A) Density histogram of a 12.8-Angstrom ribosome map showing two distinct peaks pertaining to the solvent and macromolecule. (B) 2-D slice of the density. (C) 2-D slice of the density after thresholding, i.e., after removing the solvent contribution. |
Preventing overfitting
A common concern to flexible fitting techniques is overfitting, i.e., structural distortions introduced in the atomic structure in the fitting process. The term overfitting is commonly used in many fields referring to the problem of fitting too many adjustable parameters to a limited ammount of data. In flexible fitting methods, since all degrees of freedom in the atomic structure are allowed to change, it is possible that unphysical deformations are introduced in the atomic structure in order to obtain a better fit. The problem is likely worse in the case of experimental cryo-EM maps, as opposed to noise-free simulated maps used to validade the methods and more objectively assess overfitting; experimental maps contain noise due to image aquisition and reconstruction algorithms, as well as conformational variability of the sample.
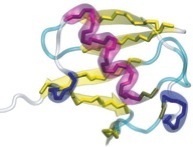
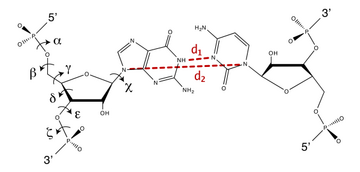
In order to prevent overfitting, MDFF introduces harmonic restraints to preserve the secondary structure of proteins and nucleic acids. For proteins, the φ and ψ dihedral angles of residues which are part of helices and β sheets are restrained to their initial position. For nucleic acids, restraints are imposed to seven dihedral angles, as well as two interatomic distances between base pairs, as illustrated in this figure:
|
|
|
|
Harmonic restraints are imposed to preserve secondary structure of proteins (left) and nucleic acids (right). |
Validation: Crystal structures of the same biomolecule captured in two conformational states
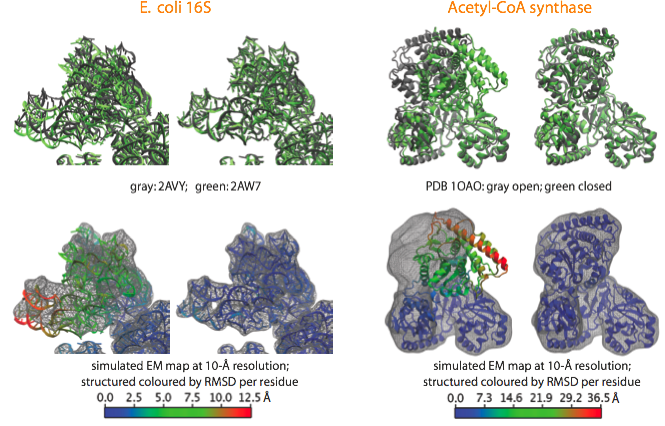
With the aim to validate the MDFF method and estimate its accuracy, we apply it to cases where crystal structures in two different conformational states are available. A noise-free simulated map is generated from conformation I, and conformation II is fitted into the simulated map using MDFF. The figure shows such fitting for the E. coli 16S RNA (PDB 2AVY, 2AW7), and the acetyl-CoA synthase (PDB 1OAO). Watch movies of these fittings: E. coli 16S (4.3Mb); Acetyl-CoA Synthase (8.5Mb).
 |
|
Examples of fittings of atomic structures into noise-free simulated maps using MDFF. (top) For each system, the target structure from which the simulated maps were generated is shown in gray and the fitted structure in green, with the initial structure on the left and the final on the right. (bottom) Same organization as before, now showing the target map and coloring the fitted structure by RMSD per residue with respect to the target structure. |
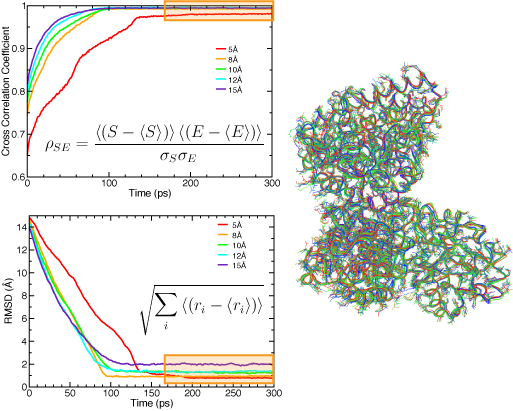
Naturally, the resolution of the EM density map determines the quality of the quasi-atomic model obtained by flexible fitting: the higher the resolution, the more information is available on the structure, and thus the smaller the uncertainty about the positions of the atoms. Sub-nanometer maps have clear information of secondary structure elements. We use RMSD (with respect to the target structure when know, and to the initial structure when using real data) and cross-correlation coefficients to monitor the progress of the fit during MDFF simulations. The figure below shows the effect of resolution on these measures. It is important to note that when these measures have converged, and thus the fitting is complete, the atomic structure fluctuates around a conformation dictated by the molecular dynamics set up, and the EM map. One can select a set of representative structures that conform to the data available in the EM map. In this way, even though the low resolution of the map results in an indeterminate problem in structure determination, we can explore different conformations that are likely present in the original EM micrographs.
|
RMSD (top) and cross-correlation coefficient (bottom) between the fitted and target structure for the acetyl-CoA synthase example, using several simulated map resolutions. The regions highlighted in orange correspond to strucutres fluctuating around an equilibrum determined by the EM map and the MD force field. A set of representative structures is shown on the right. |
Application: The bacterial ribosome
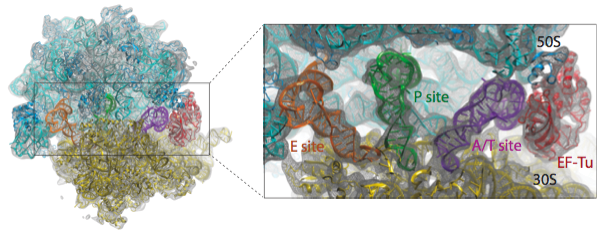
We have applied the MDFF method to obtain atomic models from cryo-EM maps of the E. coli ribosome in different functional states and imaged at different resolutions. A multi-step protocol was used in which the fitting of the RNA structure converged in the first step, followed by two steps in which the fitting of the ribosomal proteins was improved; in the last step, the remaining ligands - tRNAs and elongation factor Tu (EF-Tu) in the example presented here - were fitted. The figure below provides an overview of the fitting into a 6.7-Angstrom map of the ribosome in complex with tRNAs and EF-Tu.
Watch a movie (7.2 Mb) of the multistep protocol.
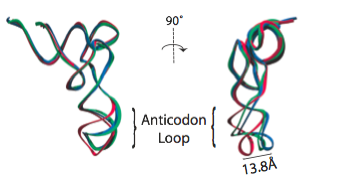
In the analysis of a previous 9.0-Angstrom cryo-EM map of the same complex, a model of the A/T-site tRNA was obtained by dividing the molecule into two parts and manually fitting them independently, followed by an optimization. A similar model was now obtained by MDFF, but this time without any assumptions. It can be seen that the anticodon loop of the tRNA bends when it binds to the ribosome, storing elastic energy which is dissipated when the tRNA is accommodated into the A site.
Watch a movie (2.7 Mb) of the fitting of the ternary complex.
  |
|
|
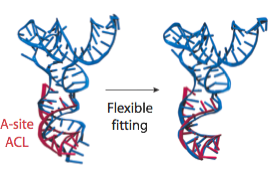
Conformation of the tRNA in the A/T site. (left) The crystal structure from the free EF-Tu:tRNA:GTP ternary complex (TC) used as a starting point for the fitting is shown in red; the A/T tRNA model obtained by MDFF is shown in blue; the A/T tRNA model previously proposed is shown in green. (right) Comparison between the A/T tRNA model (blue) and a partial crystal structure of the A-site tRNA (red).
|
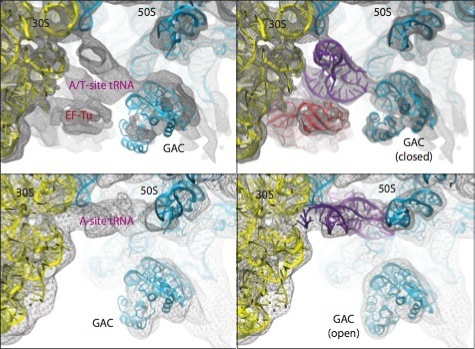
As a last example, the figure below shows the different conformations of the GTPase-associated center (GAC) obtained by applying MDFF to ribosome maps in two different functional states: bound to ternary complex (corresponding to the initial step of tRNA delivery to the ribosome) and after tRNA accommodation.
 |
|
|
Conformational dynamics of the GTPase-associated center (GAC). Shown are differences in the conformation of the GAC between the TC-bound ribosome (top) and the accommodated ribosome (bottom). Rigid-body docked structures into the corresponding maps, used as initial coordinates for flexible fitting, are shown on the left; flexibly fitted structures are shown on the right. |
Symmetry-restrained MDFF for symmetric EM data
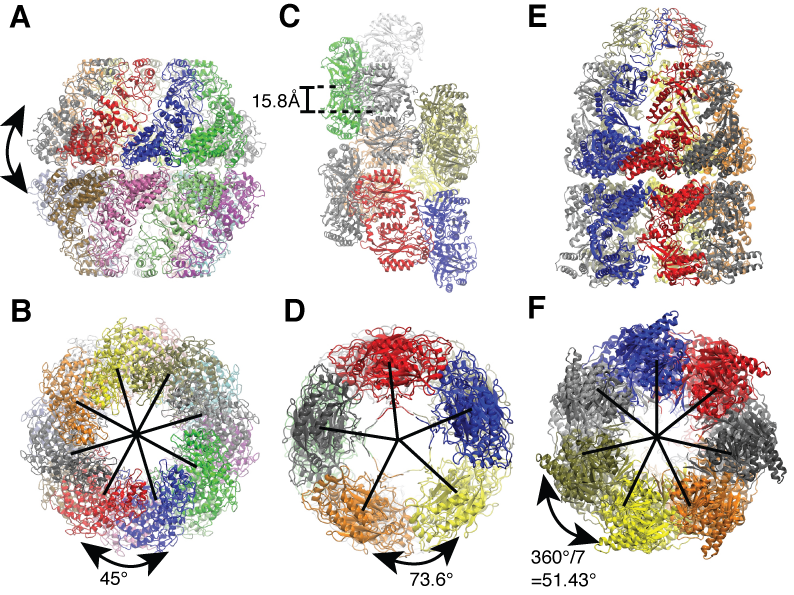
For symmetric biological systems, one can incorporate information of structural symmetry into MDFF simulations by imposing symmetry restraints which serve to maintain the symmetry during the fitting. Symmetry restraints work by an additional harmonic potential which minimize the RMSD between the current structure, which can deviate from symmetry due to thermal fluctuations, and an perfectly symmetric structure, which are iteratively calculated by averaging over all symmetric subunits along the fitting simulations. We demonstrated the benefits of using symmetry restraints on three symmetric biological systems, namely a chaperonin from the archaeon Methanococcus maripaludis (Mm-cpn), a nitrilase from Rhodococcus rhodochrous J1 and the GroEL-GroES complexes.
 |
|
|
Side and end-on view of the example application systems. (A and B) Mm-cpn (sixteen-fold symmetric). (C and D) Nitrilase of R. rhodochrous J1 (helically symmetric). (E and F) GroEL-GroES complex (seven-fold symmetric). |
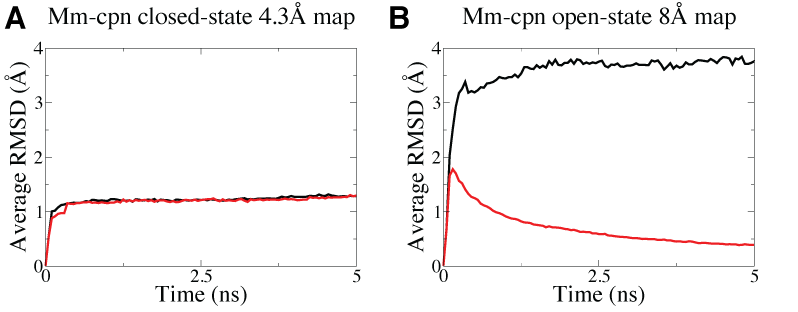
Symmetry restraints are particularly useful for lower resolution EM data as they allow more degree of freedom for the system to deviate from symmetry during the fitting, as shown in the figure below that the higher resolution Mm-cpn EM map in (A) is sufficient to maintain a symmetric structure but not for the lower resolution map in (B) which require the use of symmetry restraints to maintain the symmetry during MDFF simulations.
 |
|
|
Higher resolution Mm-cpn map (A, 4.3-Angstrom) is able to maintain a symmetric structure in MDFF simulations but not for the lower resolution map (B, 8-Angstrom), as shown in the higher average RMSD, which measure how symmetric the structure is, in the latter case when no symmetry restraints are imposed (black curve). With symmetry restraints, the symmetry is maintained as shown by the decreaing average RMSD (red curve) in the fitting of the lower resolution map. |
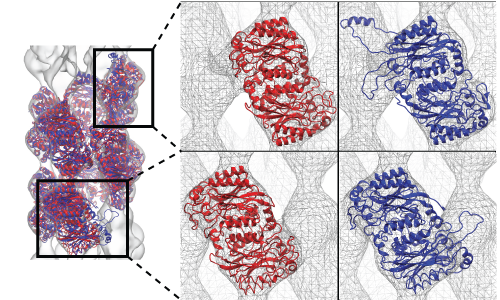
Another benefit of using symmetry restraints is to avoid the so-called edge distortion effect. When one apply MDFF to fit a part of but not the full system, e.g. to reduce computational cost, the edges of the sub-system may become distorted by pulling forces from adjacent densities which are not occupied by atoms during MDFF simulations. The edge distortion effect and the rescue by symmetry restraints was demonstrated in the fitting of the nitrilase system, as shown in the figure below.
 |
|
|
Fitting of a two-turn spiral nitrilase by MDFF in which the first and last units were attracted to the adjacent densities (blue structure) causing distortion, but was rectified by the use of symmetry restraints which maintained the correct structure of the first and last units (red structure). |
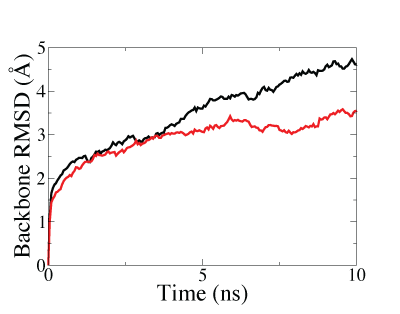
Lastly, we also demostrated that structure fitted with symmetry restraints is more stable than that fitted without symmetry restraints, making the system more suitable for further investigations by molecular dynamics (MD) simulations, as shown in the figure below.
 |
|
|
Backbone RMSD along MD equilibration simulations of the GroEL-GroES complex after fitting. The lower and faster-converged RMSD of symmetry-restrained fitted structure (red curve) than that of structure fitted without symmetry restraints (black curve) showed that higher stability can be achieved through the use of symmetry-restrained MDFF. |
xMDFF: MDFF for low-resolution X-ray Crystallography
Investigating the structure of large biomolecular complexes has posed a serious challenge to the traditional crystallography techniques. Inherent flexibility of such large systems, presence of disordered solvent and lipids or ligands often cause the crystals to diffract at low resolutions. Furthermore, in the low-resolution limit, the number of structural parameters to be determined from crystallography often exceeds that of the observed diffraction intensities. At moderate to low resolutions, knowledge of the stereochemistry of the system must be incorporated to achieve accurate atomic positions. The strengths of MDFF have been leveraged to address the difficulties of refining structures from low-resolution X-ray data to create xMDFF (MDFF for low-resolution X-ray Crystallography). For use with low-resolution X-ray crystallography, the MDFF protocol was modified to work with model-phased densities, which uses the phases calculated from a tentative model and the amplitudes from the X-ray diffraction data to produce a density map. Next, the tentative model is flexibly fitted into the electron density map using MDFF. The xMDFF-fitted structure provides new phases that, together with experimental amplitudes, are used to regenerate the electron density map. The fitted structure is then employed as an updated search model to be driven into the new model-phased density map, and this process continues iteratively.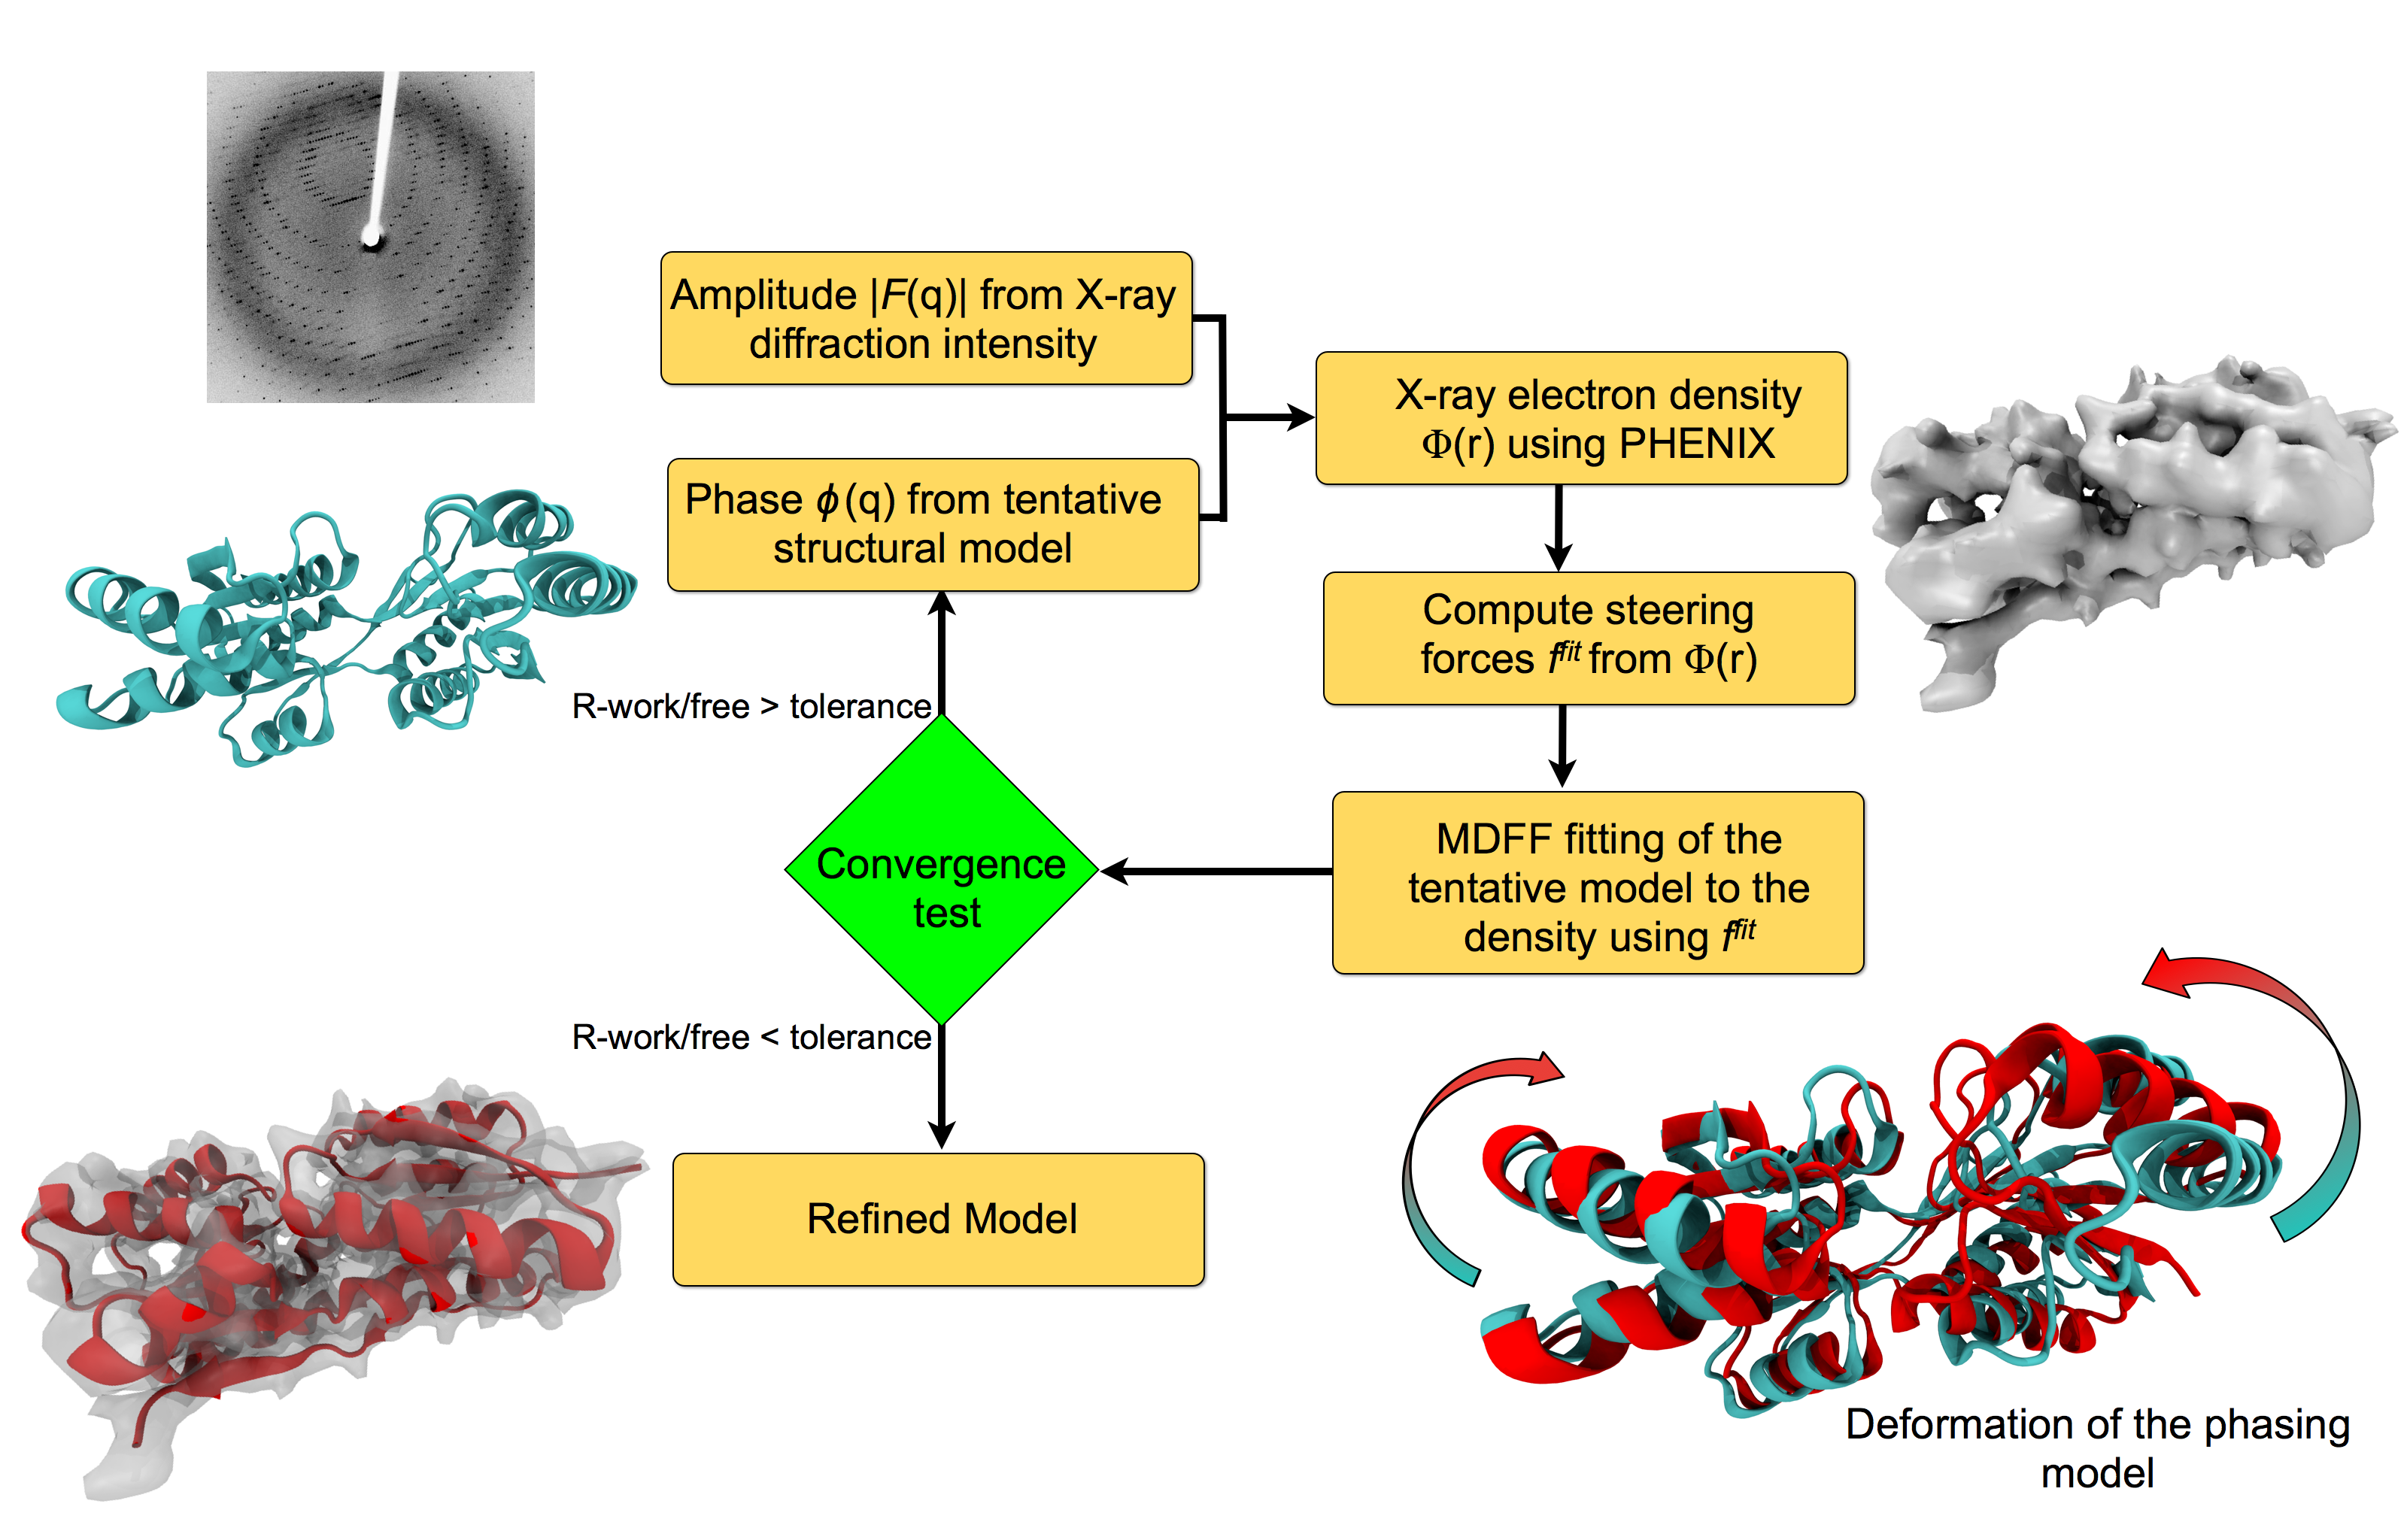
Workflow of a typical xMDFF refinement.
 |
|
|
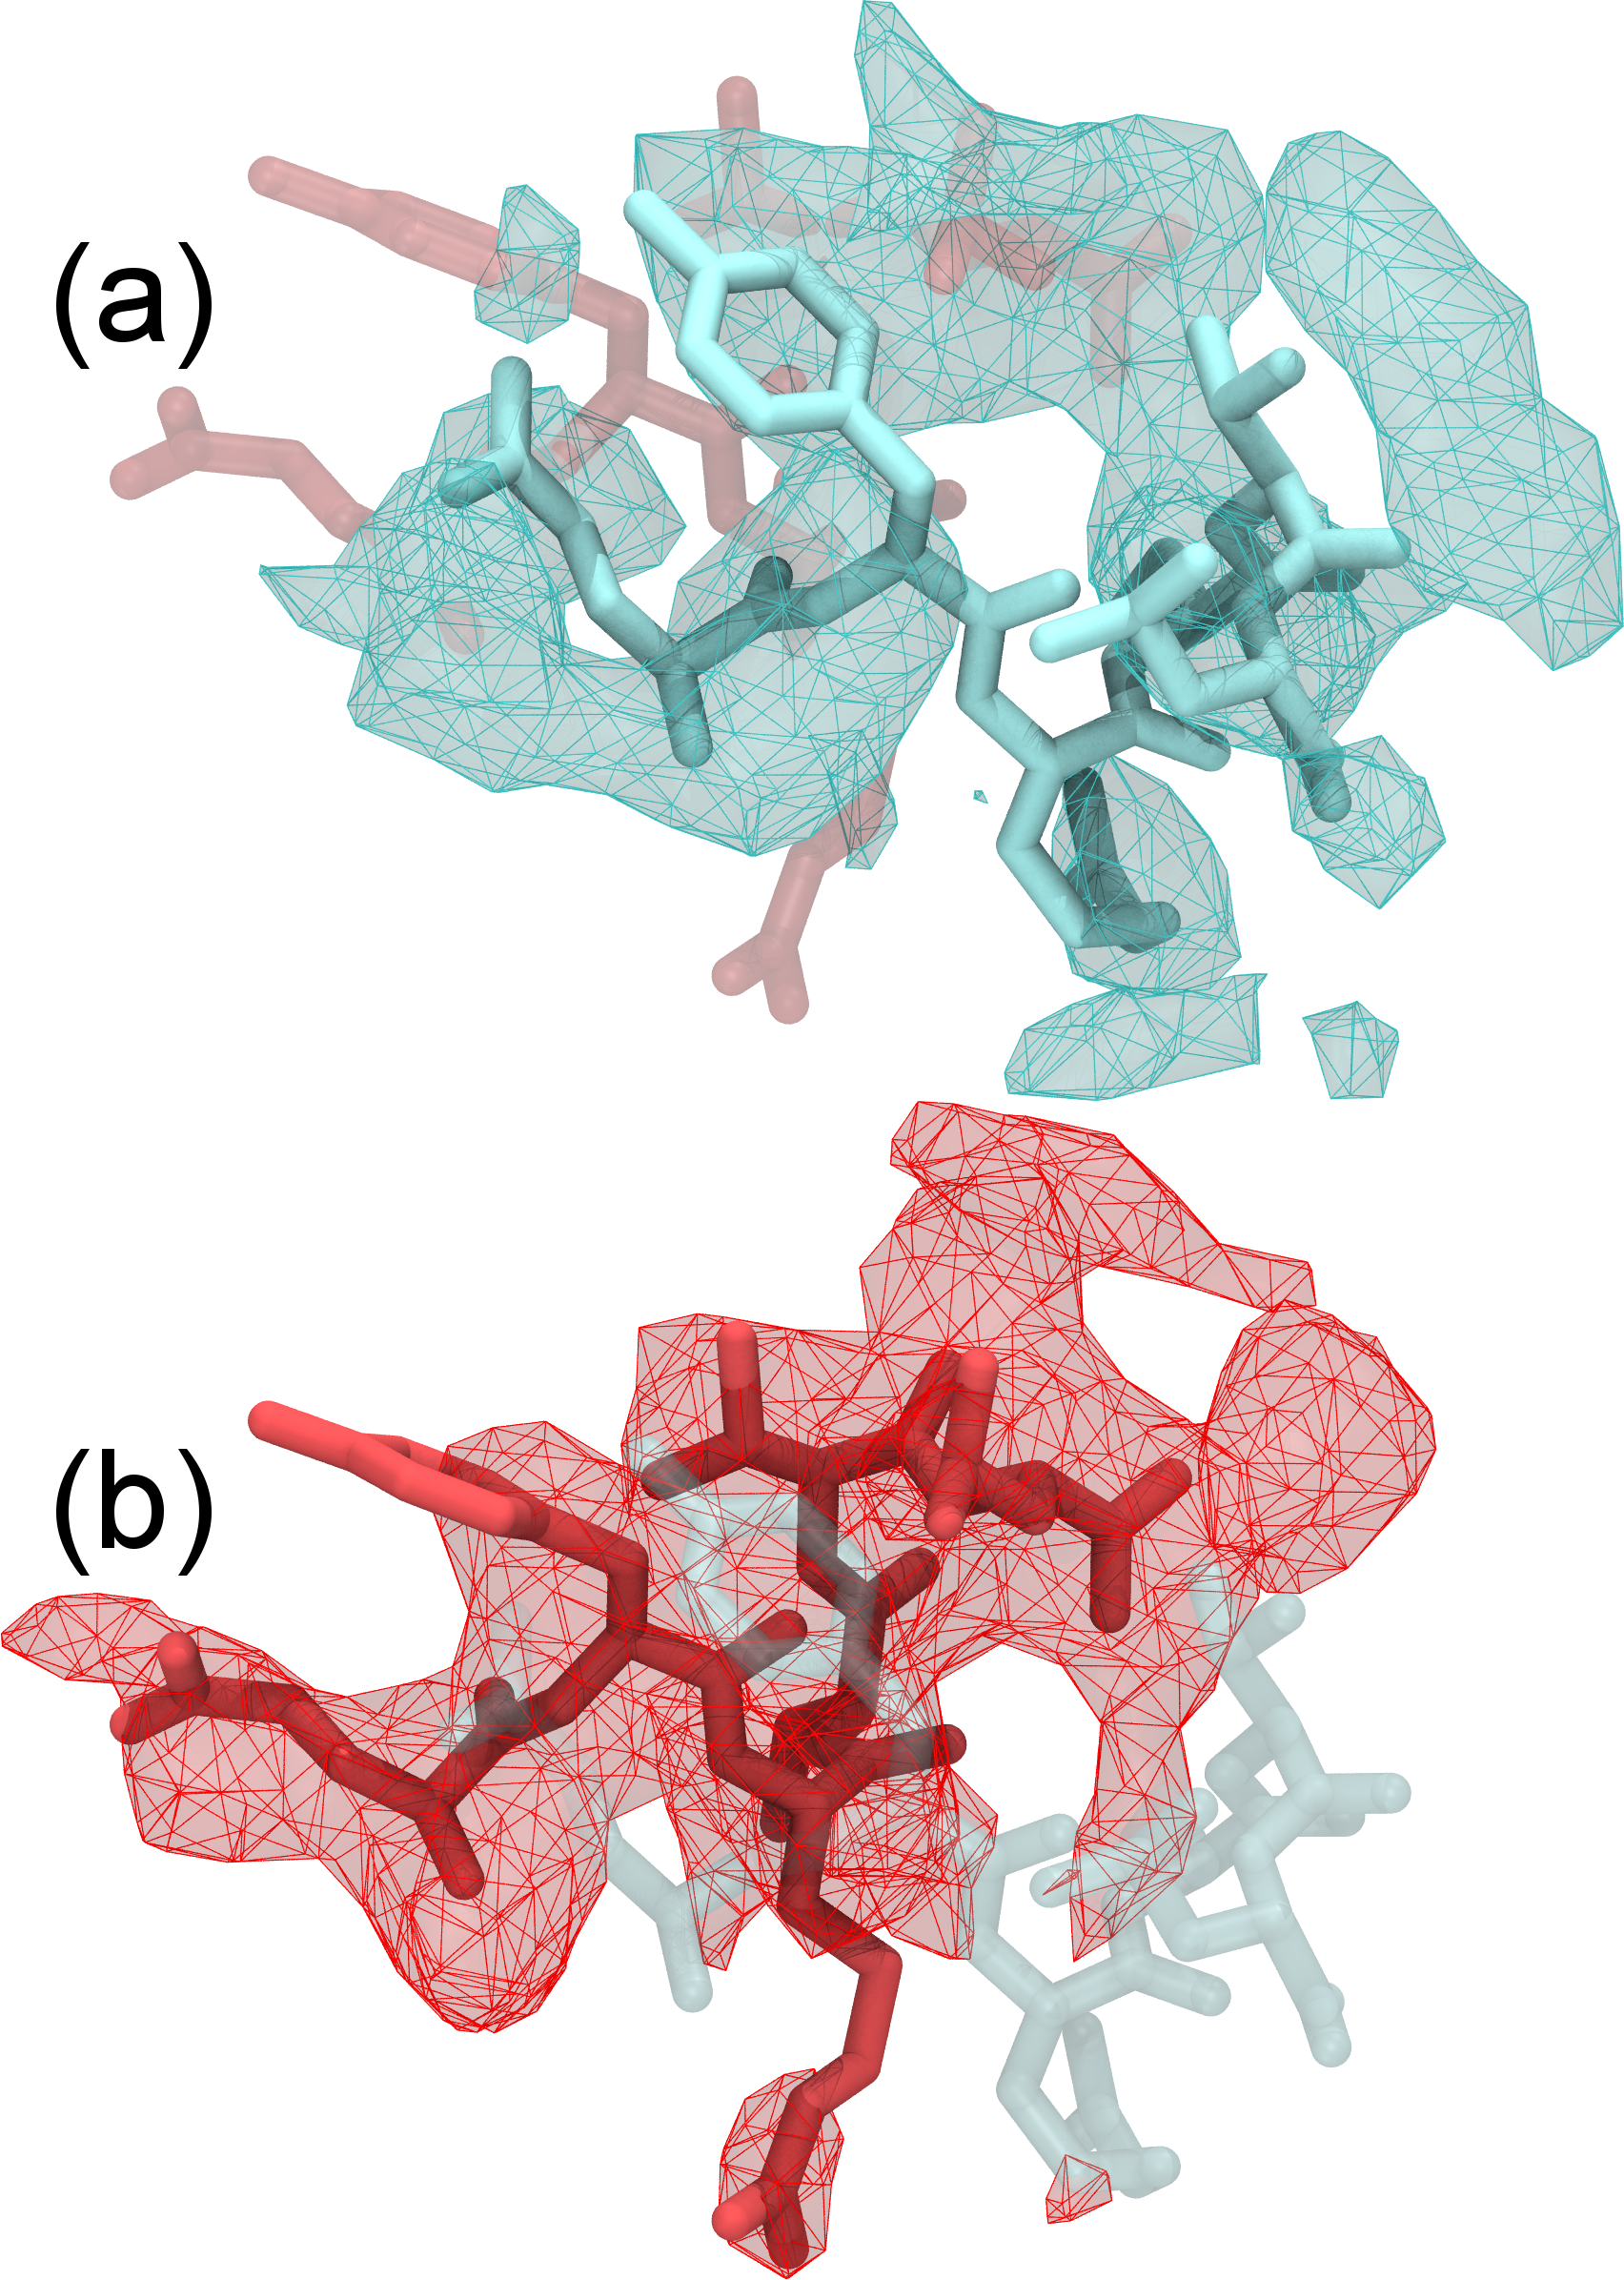
Refinement of highly flexible region in case of 1XDV. Substantial density improvements are observed in a flexible region of 1XDV, illustrated by the difference in the density map between the initial (a) and xMDFF-refined final (b) structure; Local cross correlations increase from 0.47 to 0.63, implying a more unambiguous placement of the atoms. |
xMDFF Application 1: Refinement and experimental validation of a voltage-sensor domain
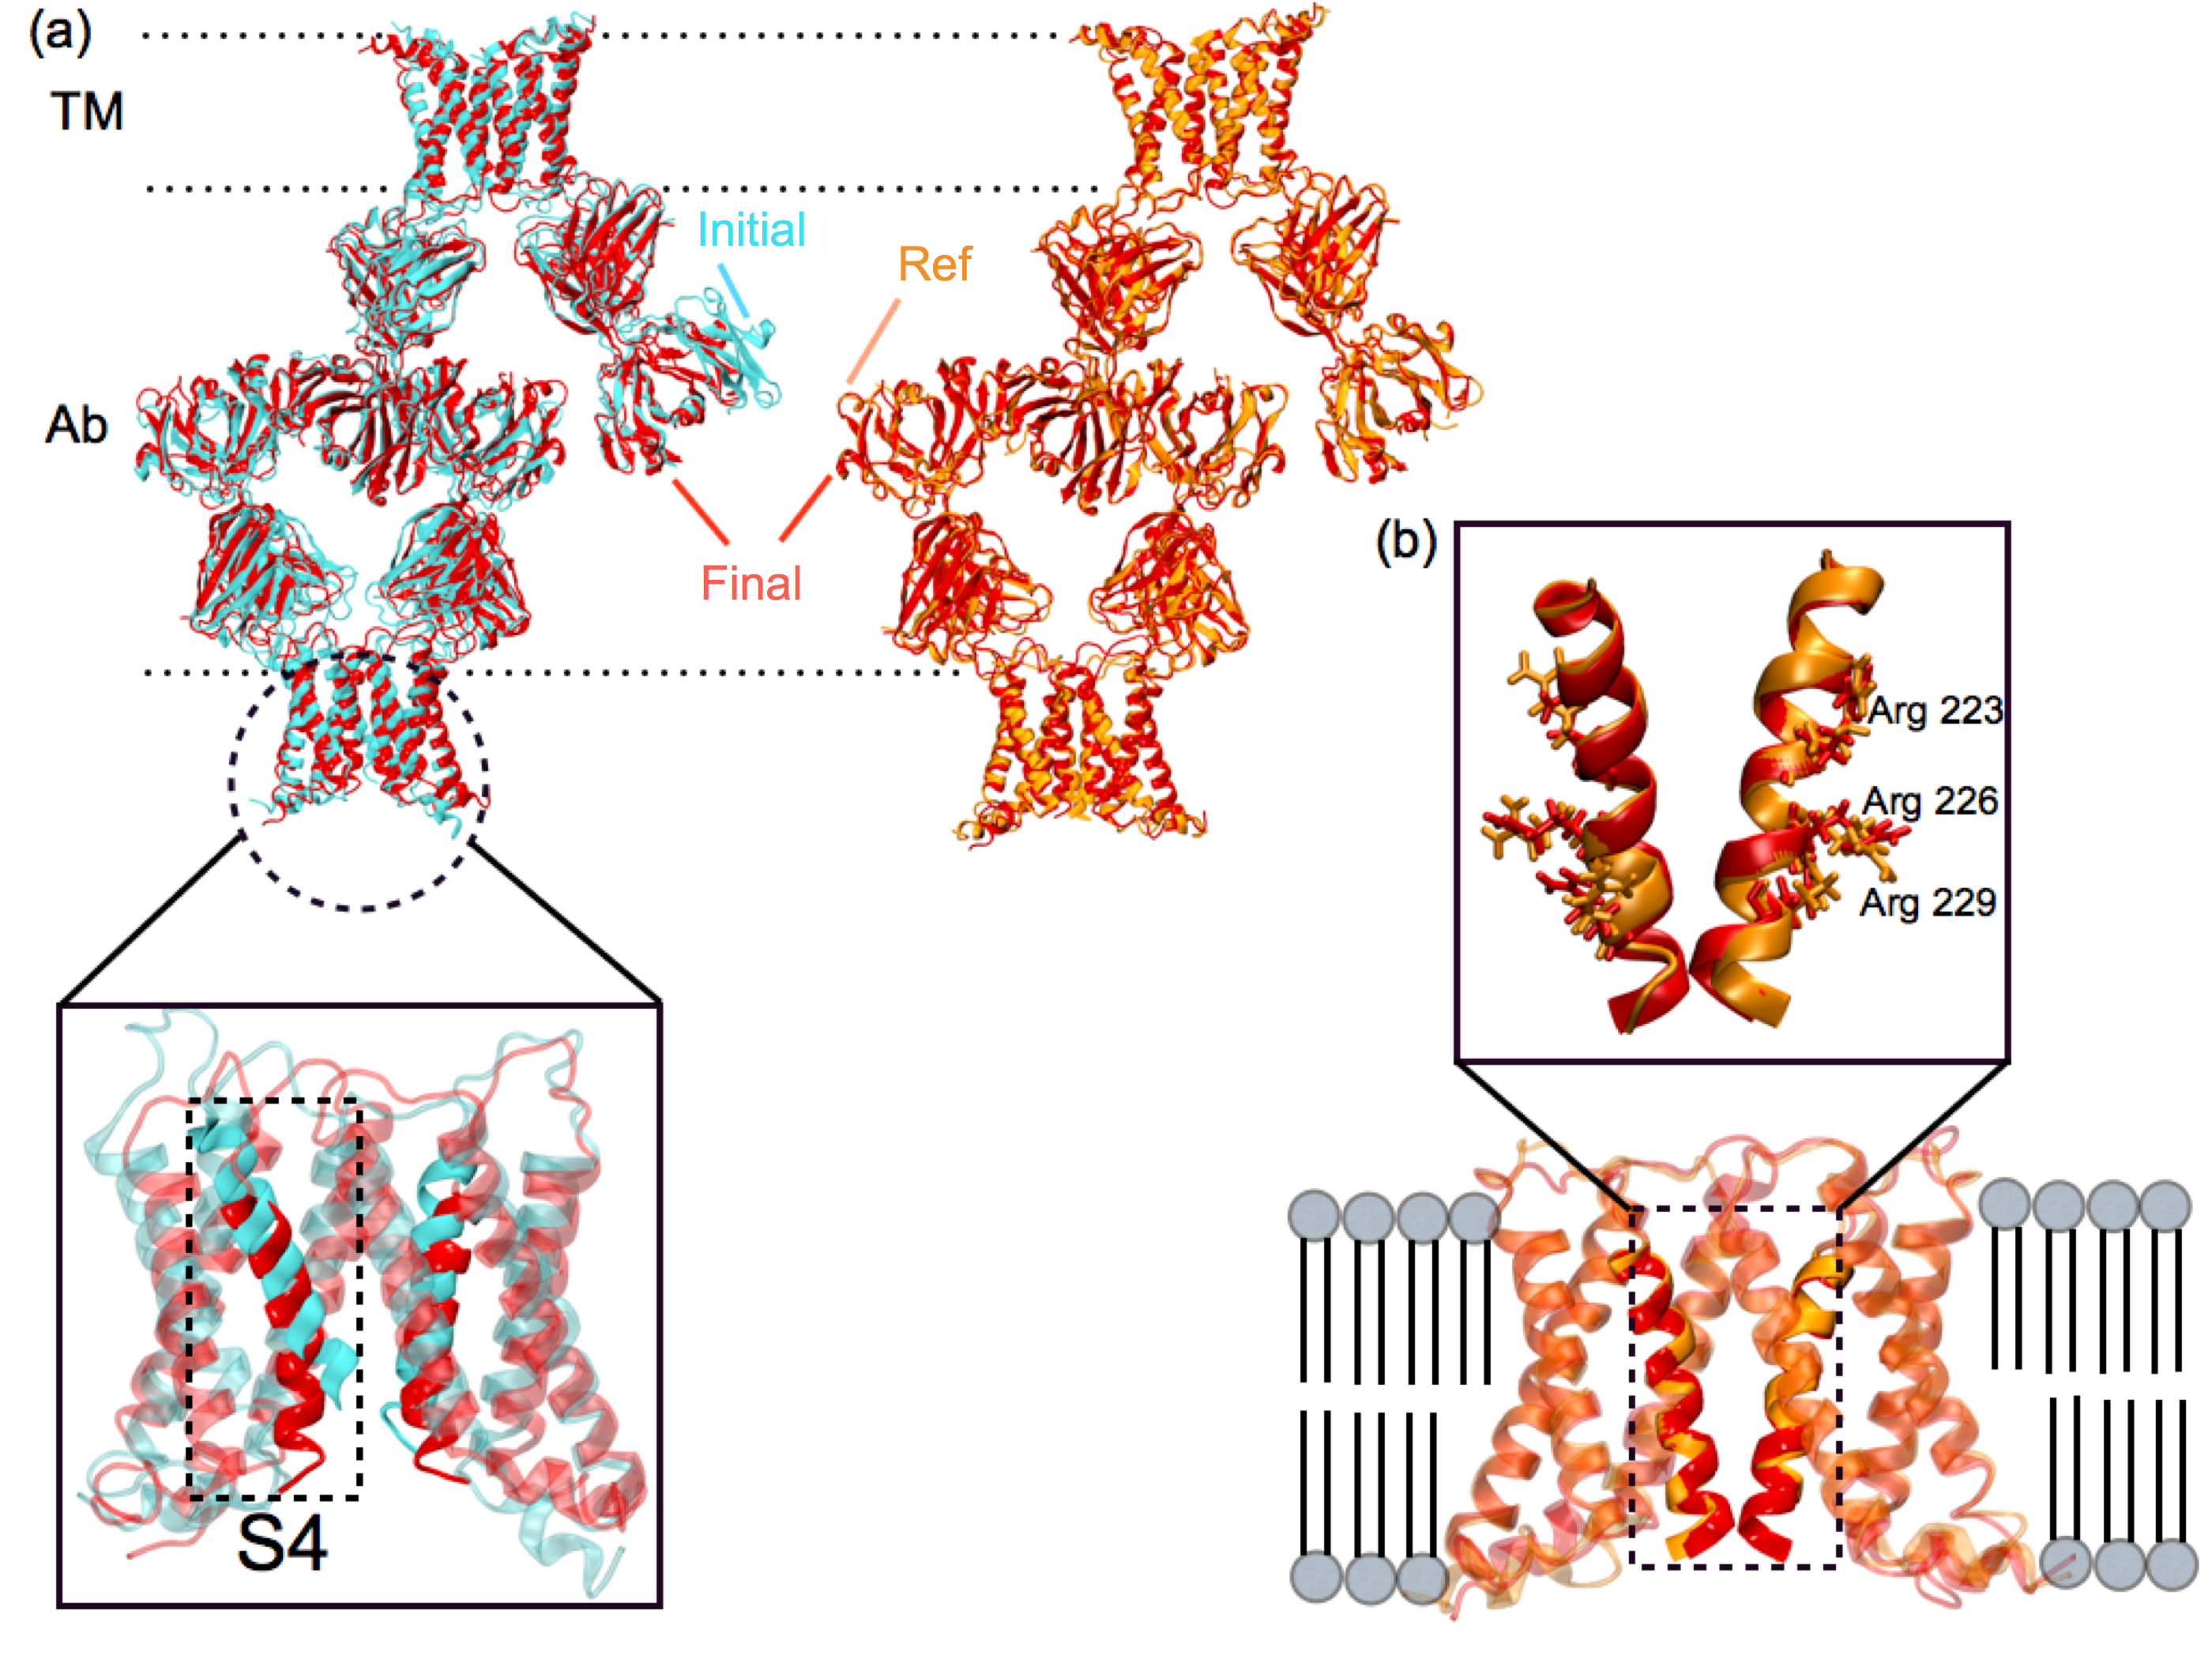
xMDFF was applied to solve the structure of a voltage-sensing protein, Ci-VSP, using 3.6, 4, and 7 Å resolution diffraction data. Voltage sensing protein is a common scaffold present in voltage gated ion channels, voltage sensitive enzymes and voltage gated proton channels, which are related to diverse important physiological functions. It is arranged as an antiparallel four transmembrane helix bundle S1-S4. The positively charged S4 helix within Ci-VSP reorients upon stimulus from a transmembrane electric field leading to downstream responses. Despite a wealth of structural and functional data, the details of this conformational change remain controversial, in particular, the movement of the S4 helix. xMDFF refinement started from a MUFOLD predicted homology model. During refinement, the tentative model underwent a remarkable large-scale deformation with an RMSD of 5.96 Å, producing a final R-free of 0.28 and 0.29, starting from the initial R-free of 0.50 and 0.48 at 3.6 and 4 Å , respectively.
 |
|
|
xMDFF refinement of voltage-sensing protein Ci-VSP. (a) A MUFOLD predicted homology model (cyan) was used as an intial phasing model in xMDFF; this model has an RMSD of 6 Å from an independently refined Ci-VSP structure (orange). (b) xMDFF refinement with 4 Å diffraction data produced a final structure (red) 2.6 Å away from the independently refined Ci-VSP structure with closely matching placement of the S4 helix. |
xMDFF Application 2: Refinement of Small-Molecules
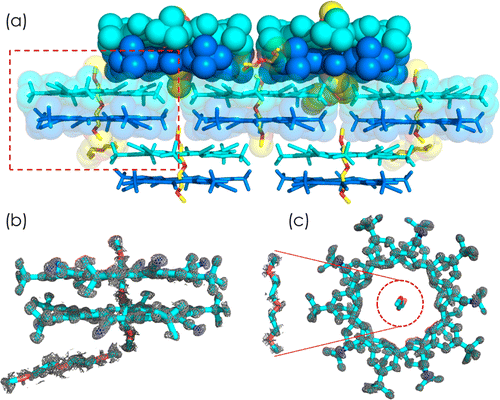
Crystal structure determination has long provided insight into structure and bonding of small molecules. When those same small molecules are designed to come together in multimolecular assemblies, such as in coordination cages, supramolecular architectures and organic-based frameworks, their crystallographic characteristics closely resemble biological macromolecules. This resemblance suggests that biomacromolecular refinement approaches be used for structure determination of abiological molecular complexes that arise in an aggregate state. Following this suggestion we investigated the crystal structure of a pentagonal macrocycle, cyanostar, by means of biological structure analysis methods and compared results to traditional small molecule methods. Cyanostar presents difficulties seen in supramolecular crystallography including whole molecule disorder and highly flexible solvent molecules sitting in macrocyclic and intermolecule void spaces. We used the force-field assisted refinement method, molecular dynamics flexible fitting algorithm for X-ray crystallography (xMDFF), along with tools from the macromolecular structure determination suite PHENIX. We found that a standard implementation of PHENIX, namely one without xMDFF, either fails to produce a solution by molecular replacement alone or produces an inaccurate structure when using generic geometry restraints, even at a very high diffraction data resolution of 0.84 Å. The problems disappear when taking advantage of xMDFF, which applies an optimized force field to realign molecular models during phasing by providing accurate restraints. The structure determination for this model system shows excellent agreement with the small-molecule methods. Therefore, the joint xMDFF-PHENIX refinement protocol provides a new strategy that uses macromolecule methods for structure determination of small molecules and their assemblies.|
|
|
|
(a) Lamellar packing of cyanostar-diglyme sandwiches in the crystal. The cyanostar dimers are colored in blue and cyan, the diglymes in yellow with their oxygen atoms in red. The red box highlights the chemical components of one unit cell constituted by (b,c) a cyanostar dimer and two diglyme solvents. |
Click here to return to the main MDFF website.
Page created and maintained by Elizabeth Villa, Leonardo Trabuco, Kwok-Yan Chan, Ryan McGreevy, and Abhi Singharoy.
This website is reproduced in part with permission from Flexible fitting of atomic structures into electron microscopy maps using molecular dynamics. L.G. Trabuco, E. Villa, K. Mitra, J. Frank, and K. Schulten. Structure, 16, 673-683; and Symmetry-restrained flexible fitting for symmetric EM maps. K-.Y. Chan, J. Gumbart, R. McGreevy, J.M. Watermeyer, B.T. Sewell and K. Schulten. Structure, 19, 1211-1218. Copyright 2008 and 2011 Elsevier.


