Graphene nanopores

Fig. 1 - Atomic model of graphene nanopore system.
DNA translocation through graphene nanopores
Nanopores have emerged as promising next generation devices for single-molecule detection, analysis and DNA sequencing. One of the drawbacks of solid-state nanopores is that the membrane thickness is about 100 times the distance between two bases in a DNA molecule. Graphene is a material with extraordinary electrical and mechanical properties. It is the thinnest known material with thickness equal to one atomic layer of carbon (0.3 nm), which is comparable to the DNA base pair stacking distance of 0.35 nm, making graphene nanopore a promising device for DNA sequencing. Graphene is also electrically active which can further be exploited to detect/control translocating DNA molecule.
In this website, we briefly describe the kinetics of DNA translocation through graphene nanopores. For more details, take a look at the publications and links on this web site or contact the investigators listed below.
Open pore characteristics
The simulation protocol used in the open-pore iv simulation is outlined here Open pore iv protocol.
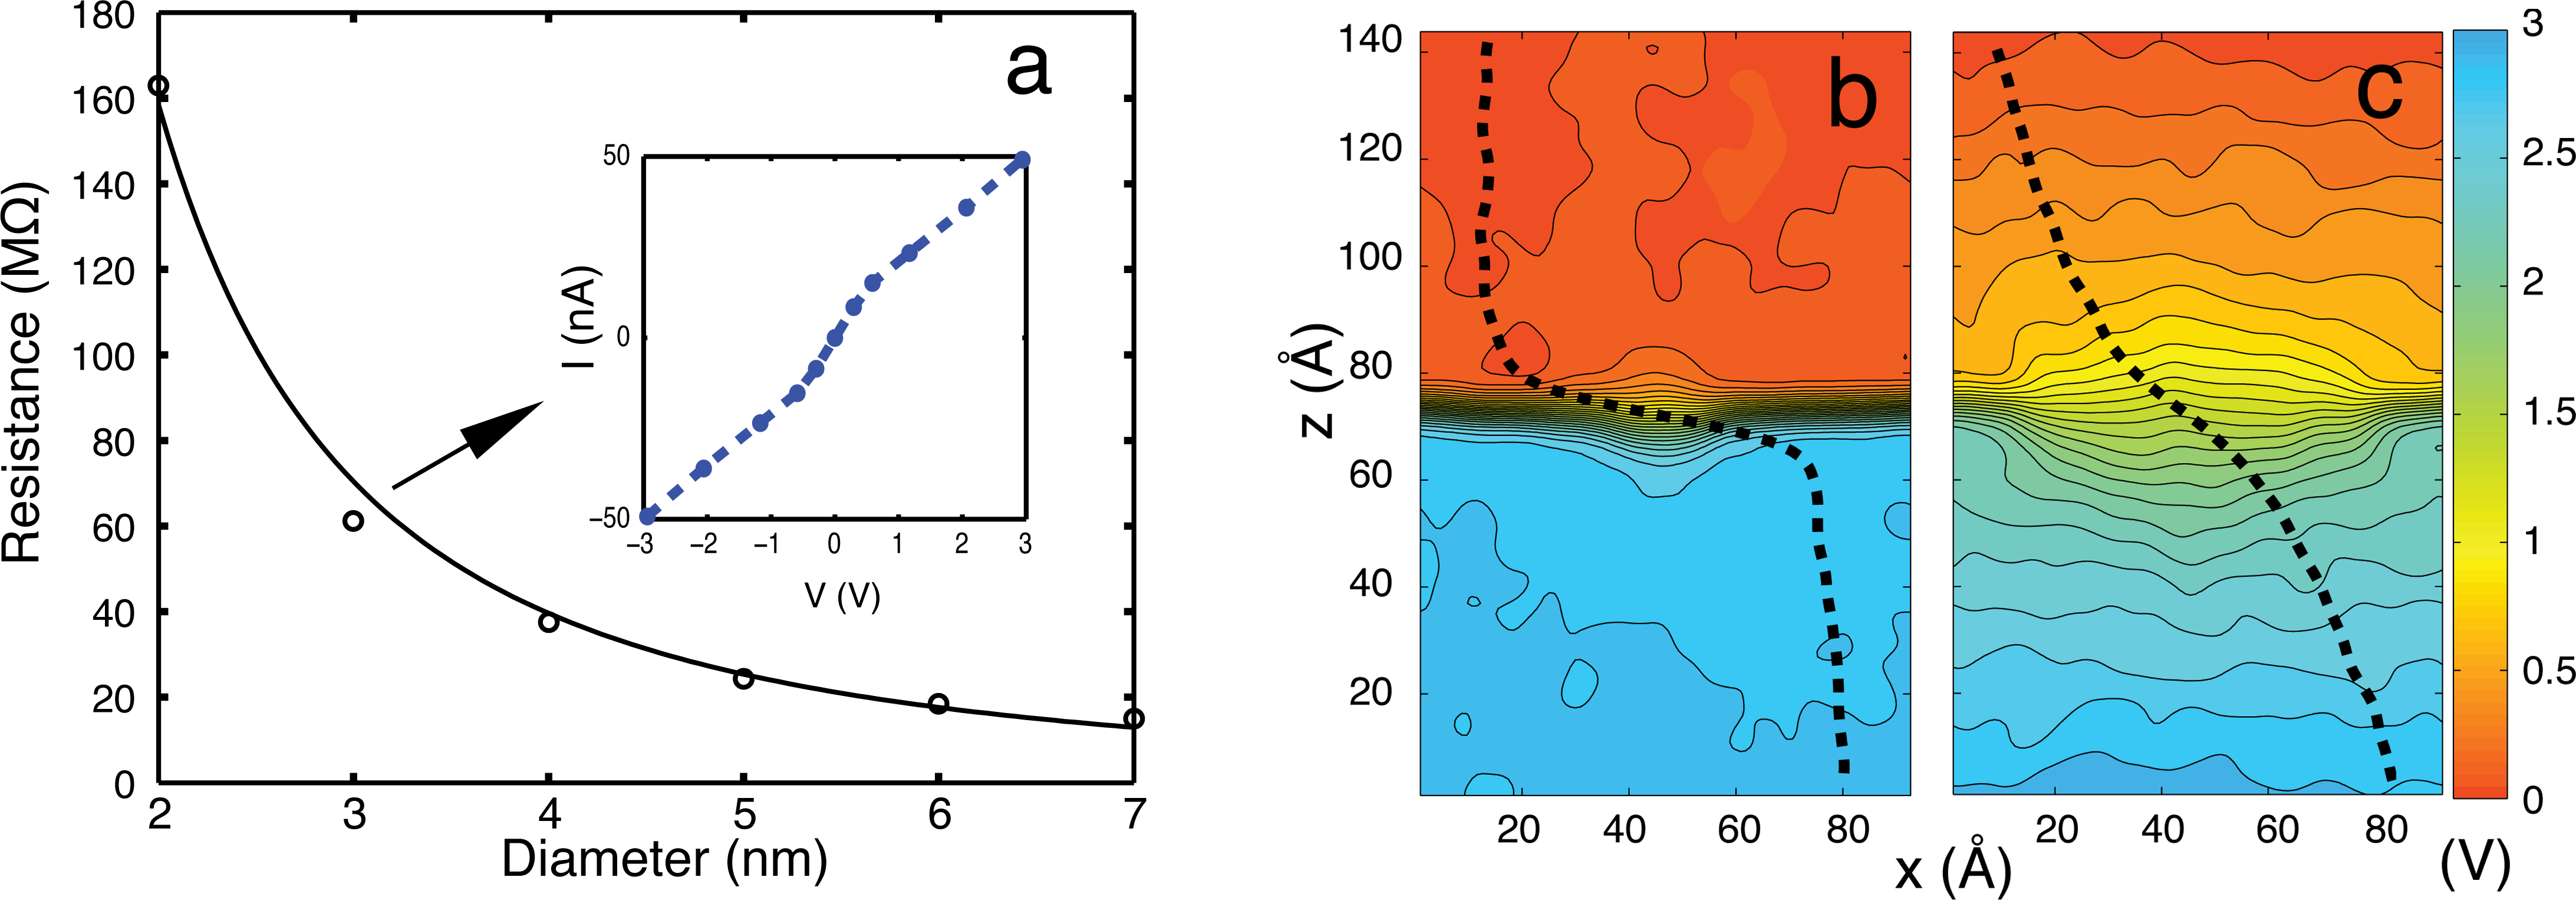
The study of open pore characteristics of graphene membranes is perfomed to access the ability of MD simulations to faithfully reproduce electric field- driven transport of ions through nanopores. A series of all-atom MD simulations are performed to compute the resistance of the pore for pore diameters in the range of 2-7 nm. The pore resistance seems to depend inversely on the square of the pore radius, consistent with experimental observations. The potential maps (see Fig. 2) illustrate that most of the potential drop arises across the membrane and the drop becomes sharper near the membrane as the size of the pore decreases.

Fig. 3 - Electrophoresis of dsDNA through graphene nanopores for bias voltages of a) 4.3 V, b) 2.5 V and c) 0.8 V.
Voltage-dependent Kinetics of DNA Transport
The kinetics of dsDNA translocation was studied at bias voltages of 4.3, 2.5 and 0.8 V. DNA was placed in all simulations in a linear head-tail configuration
at the pore mouth. As seen in Fig. 3, a characteristic blockade of the ion
current occurs when the DNA is in the nanopore and the current returns back to
the open pore value, once the DNA exits the pore. The blocking is also more
effective at lower bias voltages. The movies and the different slopes in the
center of mass (CoM) illustrate the strong hydrophobic
interaction between DNA and graphene at low applied bias which causes the DNA
Sensing using sheet currents
Graphene unlike other insulating membranes is electrically active and can be used to measure sheet currents. We show that the rotational and positional conformation of DNA strand inside a nanopore can be detected using sheet currents. A self-consistent multigrid Poisson-Boltzmann formalism was coupled with nonequilibrium Green's function technique to calculate the sheet currents through graphene nanoribbons. To demonstrate this we translocated a 24 bp dsDNA through a graphene nanopore, the rigid translocation of the DNA is equivalent to an inplane rotation of the DNA in the plane of the nanopore. The pseudorotational behaviour is captured in the conductance measured across the graphene nanoribbon, where the conductance is maximum when the backbone is in the direction of current measurement.|
Fig. 5 - DNA sensing using sheet currents. (left) Schematic of an DNA strand translocating through a graphene pore. (top right) Potential maps in the graphene plane showing one full rotation of the DNA strand. (bottom right) Conductance as a function of DNA position (snapshot) for multiple Fermi energies. |
Electronic detection of dsDNA transition from helical to zipper conformation using sheet currents

Fig. 6 - Five representative snapshots (A-E) from a single SMD trajectory of 15 base pair poly(A-T) DNA during a B-DNA (A) to zip-DNA (E) transition. Also shown is the evolution of two sets of base pairs, P-P' and Q-Q', which are a half pitch (namely 5 bp) apart.
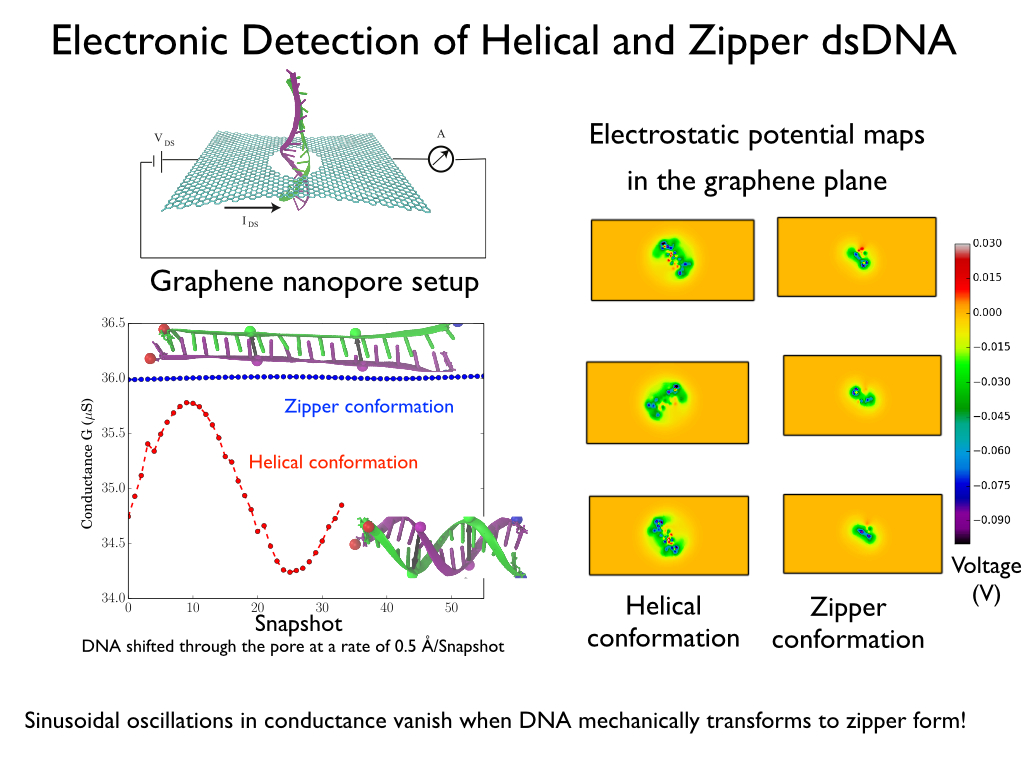
Charge distributions corresponding to DNA conformations at five intermediate steps of the B-DNA to zip-DNA transition, A through E in Figure 6, were extracted from the all-atom MD trajectory. The DNA charge distribution, for each of the intermediate stages, was then placed inside a graphene nanopore with a diameter = 2.4 nm, such that the base pair P-P' resides inside the graphene nanopore; in addition, the DNA axis was also aligned with the nanopore axis. These charge distributions were then ``translocated" along the -z direction in steps of 0.5Å, until the base pairs Q-Q' reached the pore. At each step the electrostatic potential induced by the DNA on the graphene nanopore was calculated using the Poisson-Boltzmann approach. The electrostatic potentials determined were then included in the Hamiltonian of the graphene membrane to calculate the resulting conductance across the graphene membrane. Shown in Figure 7 is the transverse conductance as a function of DNA position inside the nanopore. The DNA inside the graphene nanopore was assumed to be stretched and for this purpose the different intermediate stages (A-E) during the B-DNA to zip-DNA transformation obtained from a SMD simulation performed on 15-base pair long poly(A-T) strand were adopted. Translocation of the DNA segment, comprising of nucleotides between P-P' and Q-Q', in the helical form results in an apparent rotation of the surrounding electric field inside the nanopore . As a result, the transverse electronic conductance in the graphene membrane being induced by the field oscillates. In case of zip-DNA being translocated through the pore the field is rotationally invariant and, as a result, the transverse conductance remains constant.
Intrinsic Stepwise Translocation of Stretched ssDNA in Graphene Nanopores

Fig. 8 - (a) Simulation of stretched ssDNA through graphene nanopores. (b) Reduced structural fluctuations of DNA nucleotides.
Despite intense research efforts, the identification of individual bases has not yet been achieved by graphene nanopores, mainly because DNA translocation through the pore is too fast to permit individual bases to be resolved. Besides, the conformational fluctuations of DNA inside the pore also introduce significant noise to measured signal. Below we suggest an intrinsic stepwise translocation of single-stranded DNA (ssDNA) through graphene nanopores by simply stretching it to a straight ribbon. The stretching slows down DNA translocation and stabilizes DNA bases inside the pore.
Reduced thermal motion. Shown in Figure 8a is the simulation setup of nanopore DNA sensing. A ssDNA molecule, in a stretched conformation, is being threaded through a graphene nanopore. DNA molecules in nanopores can be readily stretched by applying an electric field inside nanopores. For the purpose of the simulations that require periodic boundary conditions for efficient calculation of electrostatic forces, the ssDNA, at its two ends, was covalently bonded to its periodic copies above and below to form an infinitely long periodic DNA strand. After a subsequent 120 ns system relation, we determine the thermal motion of each DNA base, that was considered as a major source of noise in nanopore DNA sensing, through base diffusivity. In Figure 8b, we show diffusivity of each DNA base during the system relation, determined separately along lateral (parallel with graphene plane) and longitudinal (normal to graphene plane) directions. In the lateral direction, no significant difference was seen between each DNA base. But in the longitudinal direction, one can see an approximately 100-times lower fluctuation than other bases in the DNA strand. The reduction of DNA fluctuation is actually caused by the adhesion of base to graphene surface. This reduction in fluctuation is of crucial importance to enhance signal to noise ratio for DNA sensing.

Fig. 9 - (a) Number of permeated bases through graphene nanopores. (b) Snapshots of ssDNA-graphene nanopore complex during a typical base permeation event.
Stepwise translocation. To translocate DNA through the pore, we applied external mechanical forces to the DNA molecule through constant-velocity steered molecular dynamics simulations. In Figure 9a, we show the number of DNA bases that were moved from one side of the graphene membrane to the other, when DNA is pulled. One can recognize a regular stepwise motion, each step representing the permeation of a single DNA base, as illustrated in Figure 9b.
Electronic detection. We have shown that thermal fluctuations of DNA bases adhered to the graphene pore rim are significantly reduced. A question then arises: is such fluctuation reduction beneficial for DNA detection and identification? To explore this suggestion, we performed quantum mechanical simulations to compute the sheet current flowing in a graphene nanopore device (see Figure 10a). Shown in Figure 10b is the calculated sheet current (red curve), together with the base permeation profile (blue curve). It is interesting to see that each jump in the permeation profile leads to the appearance of a dip in the sheet current profile. Because of such one-to-one correlation between base permeation and current dip, the present graphene nanopore device is able to count nucleotides in a DNA molecule through the number of dips in sheet current.
|
Fig. 10 - Electronic detection of stepwise motion of stretched ssDNA through graphene nanopore. (a) Schematic of electronic calculation model consisting of ssDNA and a graphene nanopore of 1.6 nm diameter. (b) Transverse sheet current through graphene at 0.03 eV fermi energy shown together with the number of permeated nucleotides during ssDNA translocation. |
Movies
| DNA translocation trajectory . . . | ||
 at an applied bias of 4.3 V |
 at an applied bias of 2.5 V |
 at an applied bias of 0.8 V |
 of poly(A-T) sequence at an applied bias of 1.0 V |
 at poly(G-C) sequence at an applied bias of 1.0 V |
 at a step-by-step fashion when a ssDNA is stretched |
Publications
-
Publications Database Computational investigation of DNA detection using graphene nanopores. Chaitanya Sathe, Xueqing Zou, Jean-Pierre Leburton, and Klaus Schulten. ACS Nano, 5:8842-8851, 2011. -
Publications Database Graphene quantum point contact transistor for DNA sensing. Anuj Girdhar, Chaitanya Sathe, Klaus Schulten, and Jean-Pierre Leburton. Proceedings of the National Academy of Sciences, USA, 110:16748-16753, 2013. -
Publications Database Electronic detection of dsDNA transition from helical to zipper conformation using graphene nanopores. Chaitanya Sathe, Anuj Girdhar, Jean-Pierre Leburton, and Klaus Schulten. Nanotechnology, 25:445105, 2014. (9 pages). -
Publications Database Tunable graphene quantum point contact transistor for DNA detection and characterization. Anuj Girdhar, Chaitanya Sathe, Klaus Schulten, and Jean-Pierre Leburton. Nanotechnology, 26:134005, 2015. (10 pages). -
Publications Database Intrinsic stepwise translocation of stretched ssDNA in graphene nanopores. Hu Qiu, Aditya Sarathy, Jean-Pierre Leburton, and Klaus Schulten. Nano Letters, 15:8322-8330, 2015.
Investigators
Related TCB Group Projects
Page maintained by Hu Qiu.


