Historical Series: VMD
VMD: Twenty Years of History and Innovation
By Lisa Pollack
November 2012See other related articles by L. Pollack
The directive from the granting agency committee was crystal clear: halt progress on VMD, it is a duplication of existing work. Klaus Schulten was thrilled to be awarded a five-year grant from the National Institutes of Health, but puzzled by this particular mandate about a software program his group was developing. Schulten, trained in physics, did studies in theoretical and computational biology and at this time in the early 1990s he was generating data on biological systems like proteins and lipid membranes. He needed a way to visualize the data on these living systems and VMD, or Visual Molecular Dynamics, was meant to fill this need.
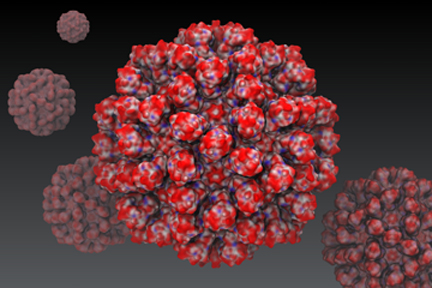
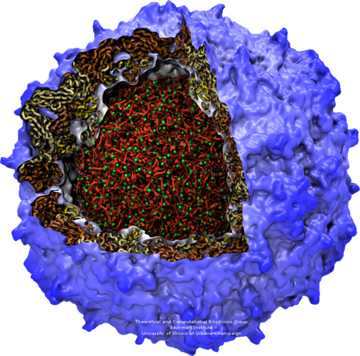
The capsid of the rabbit hemorrhagic disease virus, a system of over a million atoms, as envisioned in VMD. Image by Yanxin Liu.
The types of data in the Schulten group, mostly from calculations known as molecular dynamics, were dynamic data that charted the movements of the atoms of a biological molecule over time. The data were not static pictures, but rather moving pictures. All of the visualization software available to the community at this time in the early 1990s was useful for static molecular structures, like what a structural biologist would see from X-ray diffraction patterns. However, Schulten needed to display the trajectories of the many individual atoms of a protein all at once, over time, and essentially animate the protein in motion. This was a guiding force behind Schulten's decision to develop a visualization tool for his molecular dynamics work. In his mind there was no duplication of work because what he needed did not already exist. He needed to create it from scratch.
Since Schulten's need for visualizing dynamical data was just as important as his need to generate the data in the first place, Schulten defied the order from the grant committee and kept right on developing the software tool tailored for visualizing dynamic data. A member of the grant committee apparently was developing a molecular visualization program as well and did not want the competition. Not one to back away from risk if it could lead to new scientific discoveries, Schulten also chose to move ahead with VMD because he believed it is good to have competition. Furthermore, he felt that a technological product that appeared unusual at its inception might prove to have unmistakable merit over time.
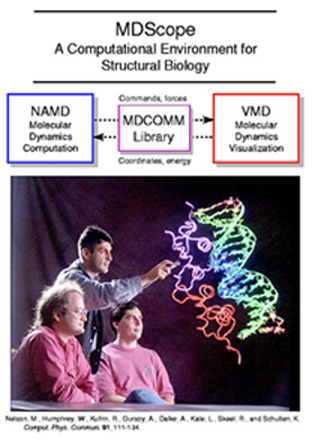
And over time Schulten came to see VMD as an integral part of something he calls the computational microscope. In essence, this microscope can elucidate behaviors of macromolecules that all other microscopies are unable to reveal. A typical light microscope is made of brass tubes and glass lenses, but the computational microscope is completely different. It is composed of scientific knowledge, software, and hardware. The scientific knowledge comes from chemistry, physics, and mathematics. The software generates data on biological molecules and then displays that data, and the hardware is often supercomputers tasked to run the software.
But how exactly does this computational microscope work? What comprises its brass and glass? Chemistry provides the means to define the forces between atoms of a molecule; with the tools of physics, those forces are used to generate the motion of the atoms. Mathematics then tells the programmers how to calculate those motions in a computer program. The brass tube of the computational microscope is essentially the software program that brings those calculations to life on computer hardware. And finally, VMD constitutes the glass lenses of the computational microscope, the tool used to actually see the details of the molecule.
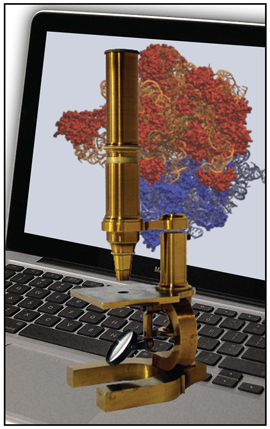
The Computational Microscope.
Early Influences on Visualization
From a very young age, growing up in Germany, Klaus Schulten had a desire to study living systems. While it might seem like biology would have been a natural field for him to choose, he instead pursued physics in college and in graduate school, influenced by a very specific aspiration. “I always told my friends,” he relays about his college days at the University of Münster, “my vision of becoming a little ant the size of an atom and crawling through cells intellectually to learn how they work.” Instead of toiling in a laboratory to unlock the mysteries of a cell, Schulten wanted to do this theoretically, with his imagination. He surmised that he needed tools to unravel the behavior of the molecules and atoms that make up living systems, and hence ended up with degrees in physics.
To realize his dream of walking through living systems at the molecular level to comprehend them, he needed to express what he imagined. This means he needed to see molecules to aid his own personal understanding, and then convey to his colleagues the information he uncovered. At a very young age he became fascinated with three-dimensional images, the kind that required red and blue cardboard glasses. He was especially intrigued by seeing molecules and proteins in three dimensions. He claims he even trained his eyes to see the images in full projection without the glasses. This got him hooked on the power of three-dimensional imagery.
By the 1980s Schulten had a position at the Technical University of Munich and was busy with a full research schedule essentially centered on biophysics. In 1985 he moved for a year to New York City as a Schaefer visiting professor at Columbia University. It was in this mega city that Schulten confirmed for himself that his dream of wandering through a biomolecule was conceivable with the aid of computer graphics.
Cyrus Levinthal, a professor in the biological sciences at Columbia University when Schulten visited there in 1985, had been working on using the computer to aid in molecular visualization since 1964. At MIT in the 1960s, Levinthal got an account on one of the first ever time-sharing computers since he heard it could display on the screen images that appeared three-dimensional because they were continuously rotating. Immediately realizing the potential of this computer to help understand and visualize proteins and protein crystals, he soon taught himself programming (in MAD, Michigan Algorithm Decoder) and became one of the earliest pioneers in molecular graphics.
By the time Schulten arrived in New York, Levinthal was no longer time sharing but had his own graphics workstation. Schulten remembers vividly that the computer took up almost an entire room, with the display screen in an adjacent chamber. Schulten got to rotate and move various molecules and, with glasses, view them in three dimensions. His interactions with Levinthal's technology only cemented his desire to fully investigate the inner workings of a living cell, which by now he realized could come to life with computers. “When I saw Levinthal's graphics at Columbia,” Schulten recounts, “this reinforced in me very clearly and very strongly that what I wanted to do was absolutely reasonable and possible.” This desire to comprehensively visualize a biological system sparked more ideas in Schulten as well. Not only did he want to crawl through cells with his imagination, he started thinking about how to make his hand the size of an atom in order to manipulate a biomolecule with the same ease that one manipulates a car with just a hand or two on a steering wheel.
Proof of Concept
Inspired by the 1984 solution of the structure of the photosynthetic reaction center, unraveled by colleagues of his near Munich, Klaus Schulten began dreaming of a plan to someday run calculations on this structure. Because the reaction center was a protein that sat in a membrane, Schulten knew he needed a sophisticated computer all to himself as well as state-of-the-art computer programs to run molecular dynamics on such a large system, for he wanted to take protein plus membrane together. Starting in 1987, while a professor in Munich, he began what would become a long journey to fulfill his dream to model the reaction center.By the time Schulten moved to a new job in 1988 at the University of Illinois, he already had several students working on building a parallel computer to handle large systems like the reaction center; additionally, many members of his group were writing various molecular dynamics codes. The codes were for both in-house machines as well as the supercomputers located in the nearby NCSA, the National Center for Supercomputing Applications, a center that had just been founded in 1985 in Champaign-Urbana.
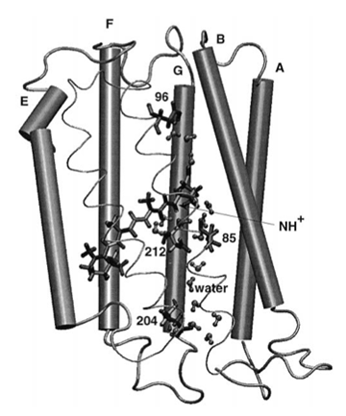
An early VMD image of bacteriorhodopsin, a protein that Bill Humprey studied as a graduate student.
In the spring of 1992, a young physics graduate student named Bill Humphrey approached Schulten to join his group and expressed an interest in a computational physics project. Since Schulten already had many projects going on in his group on computing molecular dynamics, as described above, Schulten suggested an alternative project on a virtual reality system. Some scientists just down the hall, working for the NCSA, were toying with virtual display hardware, using projection screens with stereoscopic display and 3D trackers, among other things, and Schulten thought this might prove a fruitful collaboration. Schulten also suggested that Humphrey apply to the U.S. Department of Energy for a Computational Science Graduate Fellowship to fund this work on the virtual reality system.
Mike Krogh, the NCSA scientist who had been experimenting with the display hardware, started working with Humphrey and introduced him to what he had done so far: a small program Krogh called VRChem. Humphrey started familiarizing himself with the code that Krogh had already written. When Humphrey soon received his fellowship from the Department of Energy, he now had funding to move forward with more exploration of VRChem.
VRChem was written in C++ and Humphrey, a triple major in college in math, physics, and computer science, approached it as a great opportunity to learn this relative newcomer to the programming field. His goal was to use VRChem to display the molecules that Schulten's group was studying. He and Krogh collaborated for a short time. “I knew about the molecules that we wanted to display, and the biophysics issues,” says Humphrey, “and he knew the APIs [application programming interface] for programming these things.” At that point in time, in the early 1990s, very few computers had the capability to display graphics, so Humphrey worked on expensive Silicon Graphics workstations in an NCSA lab.
Soon Krogh moved on to other projects, and eventually left NCSA. But by that time Humphrey was hooked. And he started thinking about the bigger picture. “Plus,” he relates, “it was in general this thing I did for fun when I was trying to avoid my regular graduate school work.” Because he was programming out of enjoyment, and therefore expanding the features of the software, he made a decision when Mike Krogh left. “At that point I just took over the code entirely and said: Well this has been fun but I have kind of bigger things I'd like to do,” recollects Humphrey. “And so I pretty much rewrote the whole code, with this same general idea, but I started with a whole new code base, and that's when I renamed it to VMD.” VMD thus began in 1993 after Humphrey decided his initial proof of concept definitely merited further development. He wanted to add some bigger levels of functionality and create VMD to be a general-purpose molecular dynamics simulation display and analysis tool. “And so the name is really brilliant” comments Schulten, “because basically VMD was from the outset made for dynamic data, even though most people don't use it that way today. It was made to also showcase dynamic data and so we called it Visual Molecular Dynamics so you could see molecular dynamics visually.”
VMD Early Days
Humphrey had modest goals at first. He wanted to animate the data generated from standard molecular dynamics applications like X-PLOR and CHARMM, which were software programs popular at the time (and are still in use). Most graphics programs in those days provided a static snapshot of the trajectory information generated in molecular dynamics calculations, but Humphrey and Schulten were eager to basically generate a movie on screen from the data. They were not trying to compete with other molecular graphics programs of the day. One of the other early goals with VMD was to take advantage of stereoscopic display equipment and input devices that were state of the art at the time. Some of the cutting-edge display equipment that Humphrey had access to was located at NCSA, and he also worked on the 3D display possibilities available with Silicon Graphics workstations. Hence from very early on Humphrey laid the groundwork for VMD to support all sorts of novel display and input technologies, and over the years VMD would continue to support graphics hardware that appeared on the scene. And there was no push in these early stages to make VMD work on any machine other than a Silicon Graphics workstation.
VMD hooked up to a projector. Tom Bishop, Bill Humphrey, Willy Wriggers and Andrew Dalke circa 1994. Photo used with permission of Rich Saal of the Illinois State Journal-Register.
Humphrey's enthusiasm for C++ rubbed off on the other graduate students in the group, and was a major factor in usage of this programming language for the molecular dynamics program NAMD that Schulten's group would produce for the scientific community in 1995. At the time, NAMD was unique in its use of C++ for a molecular dynamics software that was designed to run in parallel. The students, who realized C++ was a risky choice, actually devised NAMD in secret, and then sprung it on their advisors, a story that is told in more detail at this URL.
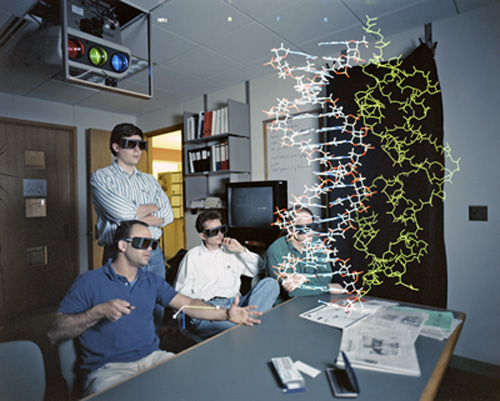
By late 1993 Humprey had a fine working skeleton of VMD mapped out, and soon physics graduate student Andrew Dalke joined Humphrey in crafting VMD. With a working model of VMD, Schulten's group now could do many kinds of graphical analysis of the biomolecules under study, and include those results in their scientific publications. Humphrey states that the very early successes of VMD helped Schulten justify asking for grant money to further develop VMD and buy graphics hardware to connect to VMD. One of those pieces of hardware, which Schulten's group acquired, was a projector and a spatial tracking system; this brought Schulten one step closer to his dream of going inside a macromolecule to explore its function. The equipment, which cost roughly $20,000 in 1993, produced a large three-dimensional image that many scientists could view at once. The spatial tracking device, basically a 3D mouse, could change the viewpoint of the image. The magnified molecule took up the good part of a room, as can be seen in the photo above. VMD was the conduit that connected expensive display hardware with the molecular world.
While Schulten was fulfilling one dream to wander inside a biomolecule, he also had the further aspiration to somehow manipulate that molecule as its atoms danced their dance in the course of molecular dynamics animations. For example, he wanted the ability to pull on a substrate bound to an enzyme or to stretch or unfold a protein. What this required was connection to a running simulation, a graphics computer to display the simulation in real time, and a mouse to pull on an atom. The early program VRChem had a rudimentary ability to make this interaction happen. In fact, by 1992 VRChem had been connected to a supercomputer at NCSA called the Connection Machine 2000, while it ran a molecular dynamics simulation. Bill Humphrey worked with Rick Kufrin at NCSA on this capability.
Andrew Dalke, Attila Gursoy and Bill Humphrey circa 1995.
When VMD was born, Humphrey and Dalke updated it to include an interface for starting up and viewing NAMD calculations that were running on remote computers, either supercomputers or workstations. With Kufrin, they wrote a connection code, called MDComm, from the VMD GUI to the simulation. This allowed a user to not only view the simulation in real time, but also to use a 3D pointer to click on an atom and “pull” it. This force was sent to the simulation. Immediately visible was the effect of that force on the surrounding atoms. This early capability of VRChem and VMD would soon come to be called Interactive Molecular Dynamics, and, in the early 1990s, Schulten considered it bleeding-edge technology. Schulten's desire to interact with a molecule in real time in a more natural way than this early incarnation would be a goal for the next twenty years.
VMD Grows Sophisticated, and is Released to the Public
By 1994 Humphrey and Dalke were spending a great deal of their time working on VMD, and both enjoyed the challenges of the project. Although the pair were graduate students in the physics department, they both had some background in graphics; each had triple majored in college in math, physics, and computer science. Each had taken graphics courses as undergraduates. In fact, Humphrey states that he was quite familiar with graphics concepts, but never had access to sophisticated hardware until he started studying in Champaign-Urbana. He actually came to the University of Illinois because it was known to be a computationally oriented school, and even housed a supercomputer center, the NCSA. During this time, around 1994, they worked on adding more visualization features, such as coloring and rendering options.In 1995 Humphrey made a critical decision. “My last year of graduate school I said: I've got to stop having fun and get my final papers done and my thesis written,” explains Humphrey. So he backed off from doing major coding, while still keeping track of new developments and occasionally testing VMD. But by now Andrew Dalke was hooked. He realized he enjoyed programming more than doing research and took a leave of absence from the graduate program to become the main developer of VMD from 1995–1997.
One of the main things Dalke worked on was improving the scriptability. In VMD there are menus with options like how to choose various drawing styles or to select only a segment of a structure for display. However, VMD is an analysis tool; Schulten and his team knew that they could not foresee every possible kind of analysis and calculation that users might need. To build this flexibility into the program, a scripting language was embedded in VMD that users could take advantage of to meet their own needs.
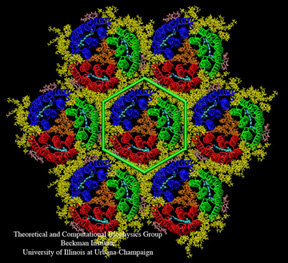
Bacteriorhodopsin in a purple membrane. A script was used to draw the bright green hexagon in the middle of the image.
During his years of developing VMD, Dalke implemented the chemistry perception and the atom selection language, and included an interface to a molecular surface generation program. Dalke also collaborated with Ivo Hofacker to implement the “save state” feature so that users could save their changes for use in a later session. Dalke also worked on the biochemistry. When a user loads a structure file, such as a PDB file, Dalke implemented code, through a parser, to figure out what part of the structure is DNA or a protein, etc. If a protein is detected, VMD could then figure out which parts are the backbone or the side chains.
The year 1996 marked the publication of the famous VMD paper, which now has 8,658 citations. Simply titled “VMD: Visual Molecular Dynamics,” the article describes the features of the software and then contains a paragraph about how others can download the source code and binaries for their own use on Silicon Graphics workstations. The official release of VMD occurred on July 1, 1995, and a year later over 800 people had downloaded the program.
Schulten says it was an obvious decision to make VMD a freely-available software for the community. He was motivated by several factors. VMD had grown into a powerful program for graphics, which Schulten used constantly in his own research. He realized not everyone could write their own graphics programs and so thought others could benefit from this tool. He also cites the fact that, trivially, development of VMD was happening at a time when he had funding. In 1992 the NIH awarded Schulten a five-year grant; thus began the birth of an NIH technology resource in Illinois, now called the Center for Macromolecular Modeling and Bioinformatics. And so the interval from 1992 to 1997, a period of guaranteed funding, coincided with rapid improvements in VMD. Schulten was aware of the growing sophistication and potential of the program, and this fact would lead to a move that drastically altered the face of VMD, and provided it a fresh and imaginative vision for the new millennium.
A New Face for VMD
By 1997 Schulten's group, located in the Beckman Institute at the University of Illinois, had two software products freely available for the community: VMD, and NAMD, a program tailored for parallel computing of molecular dynamics. Schulten, a physicist by training, realized he needed input from computer scientists to craft NAMD into a first-rate program, one that could survive years of alteration and a continuous influx of new computers. Since the university in Urbana-Champaign is relatively large, Schulten found collaborators for NAMD in the computer science department, and his needs for this program were taken care of more or less in-house.
However, the story for VMD was different. Graduate students in physics, some who had undergraduate training in computer science, had been the main developers and maintainers of VMD, up to 1998. Schulten says that the graphics people on campus were more interested in basic science research and were not interested in taking charge of a graphics application like VMD. This fact, along with the burgeoning growth of VMD that clued Schulten into its potential, clearly pointed to one thing: Schulten needed to hire a full-time graphics programmer. And when the choice seemed too good to be true, Schulten thought something must be terribly wrong.
John Stone, who became the primary developer of VMD in 1998.
When he learned about a position at the University of Illinois doing molecular graphics, John Stone was working in industry on digital video compression, but wanted a job that was more research-oriented. Trained as a computer scientist, at the University of Missouri-Rolla, with a focus on computer graphics and parallel processing, Stone had done, among many things, research and development in the commercial world. While he liked the research part, he quickly realized that was not a major focus for a company. “I mean sometimes there are new things,” says Stone of his industry days. “But the newness goes away very rapidly and instead they're concerned with: how do we make more money.” Stone recalls that back in the 1990s, computer scientists like himself had limited options for where to live, as the major hubs were on the West Coast, in Silicon Valley or Redmond, Washington. He was further limited by his specialty. “I wanted to get back into 3D computer graphics,” Stone recalls. “And in those days, the only place you could find people doing that was in the research world, because in the 1990s, there were only a handful of computers that were even capable of doing real-time computer graphics.” While the position in Schulten's research group working on interactive molecular graphics seemed like a good fit for his needs, he also saw a bigger picture. The extensive work on parallel processing because of NAMD attracted Stone as well, and he realized his interests in parallel computing overlapped with the group's focus.
“We had a hard time offering the job to him, for the simple reason that he was too good,” Klaus Schulten explains with the utmost sincerity. Schulten felt that this remarkable candidate could have gone anywhere and was puzzled as to why he was interested in a modest position essentially in the middle of nothing but cornfields. But Stone spelled out his reasons for wanting to leave industry, and what he was looking for in his next job. “He wanted to work on one piece of software with which he could identify, and which he could pursue for a longer time,” Schulten recalls. “And that is what we could offer him.”
VMD would begin a new era with the hiring of John Stone in 1998. Schulten is clear to point out that Stone's role in making VMD such a huge success cannot be overstated. A working partnership soon developed between the two men, and that is something that makes this history unique; VMD essentially has two leaders at the helm. But, according to Schulten, one of the keys to this successful partnership is that the two can talk to each other, even though both approach issues with completely different backgrounds. “We both communicate well to each other what is scientifically needed and what is technologically feasible,” notes Schulten. A major goal in Schulten's life has been to understand the science of cellular biology, using the computational microscope instead of a light microscope. He cites two aspects of computers that are important to him: that the best available forms of computing technology to advance scientific discoveries are available, and that the latest computing technologies flow as rapidly as possible into the hands of scientists. These two facets inform how Schulten approaches his vision for VMD.
“That's one of the reasons I like working in this group with Klaus on VMD,” reflects Stone, “because I have the opportunity to do things that are genuinely new and that have never been done before.” Schulten is a scientist who is not afraid to take risks; Stone, who has worked with Schulten for almost fifteen years in a field where frequent job changes are routine, relishes the challenges of new projects and is willing to take risks himself. “
|
"WE HAD A HARD TIME OFFERING THE JOB TO HIM, FOR THE SIMPLE REASON THAT HE WAS TOO GOOD." Klaus Schulten |
While Stone enjoys the challenges of the risky projects he and Schulten dream up, he is challenged in other ways by Schulten as well. According to Stone, Schulten is the “ultimate user,” always advocating for things to be more automatic and straightforward in VMD. For example, one of the earliest requests by Schulten was that he wanted to make a movie of a molecule and drop it into a presentation slide or send it to a collaborator. For example, Stone indicates that Schulten wanted an animation of a molecule rotating to be as easy as a click of a button or two. The two men communicated about this feature over and over as Stone presented prototypes of a movie maker, and Stone ran through about five or six permutations until Schulten got exactly what he imagined. Stone is quick to point out that Schulten has done his share of programming in his career and is very appreciative of the work that Stone puts it. But Schulten is not familiar with the minutiae of VMD's code, and Stone sees that as a benefit for the growth of the software. “If he knew how much difficulty some of these things would have been to implement, he probably wouldn't have asked for it,” notes Stone. “It's almost better not to know.” That really paid off with the advent of the movie-making feature, as VMD was most likely the first molecular visualization program to include this option.
VMD Grows in Popularity
One of the first tasks for Stone in his new position was to port VMD to other computers as VMD was originally written just for Silicon Graphics workstations. There were many reasons to get VMD on other machines. Stone recalls that when he joined in 1998, the group had about four Silicon Graphics workstations. One was so huge it lived in its own room; Stone likes to point out that computing graphics required such large machines that 1980s arcade games like Pac Man or Space Invaders actually needed to be the size of refrigerators. These Silicon Graphics workstations in the group were extremely expensive computers, which required additional hefty maintenance contracts. Members of the group often had to wait in line to use VMD, and graduate students might only get on a computer in the middle of the night. The desktop machines everyone was using at the time, NeXT and Hewlett Packard computers, did not run VMD; the era of an affordable desktop that met every need, ubiquitous today, had not arrived in the late 1990s. Schulten continued to buy cheaper graphics workstations from 1998–2002, so that more researchers could have them on their desks. If Stone ported VMD to all desktops and graphics workstations in the group, not only would more people have access to VMD, but the group could also save money in their equipment budget by using cheaper machines
These first machines that Stone ported to were all flavors of Unix, the operating system of the Silicon Graphics workstations. Although Stone says it made sense to start with machines that ran Unix, as opposed to an operating system like Windows, he still needed to be attentive. “The total number of lines of code that changed between all those different versions of UNIX is maybe a few thousand lines of code,” he recalls. For example, on the Silicon Graphics workstations it was a matter of a simple subroutine to draw text on the screen, but most of the other computers completely lacked the subroutines to do this, so Stone had to write code from scratch for this task. By this time VMD was about a quarter of a million lines of code, and Stone, to put things into perspective, is clear to point out that his porting nightmares had yet to begin with this Unix undertaking.
While making VMD run on all the different computers in Schulten's research group had obvious benefits for the group, Schulten also had to pay attention to the number of outside people using VMD, since he was getting grant money to make this software freely available to the scientific community. Porting to Unix workstations was important because many scientists used these computers for their research; in contrast to workstations, not all personal computers in the 1990s had processors capable of floating point arithmetic and many were not equipped to display graphics. But by the turn of the century, personal computers became quite powerful and affordable. It was clear that if Stone could port VMD to the Windows operating system, VMD would reach a much wider audience.
“It's really hard to express how difficult that was,” declares Stone about the PC porting project. “It was one of the most challenging things I probably ever had to do because there was so much code that had to be rewritten from scratch.” Apparently there were thousands of occurrences where Windows and Unix had no comparable functionality, such as the text issue mentioned above to name only one. Not only did these issues need to be addressed, but Stone had to contend with the fact that while VMD ran well on powerful and fast machines like the Silicon Graphics workstations, on weaker computers like PCs, VMD was unusable. So he had to be inventive. “I spent many months and years basically improving the code in VMD over and over and over again,” he reiterates, “rewriting large parts of the program to eliminate things that were beyond the capabilities of the PC, or that were not efficient as they could be.” He estimates he had to alter between 20,000 to 30,000 lines of code in this port to Windows. He also ported to Mac OS X in 2001, where the graphical user interface details proved a challenge, and he recounts it was no small feat either.
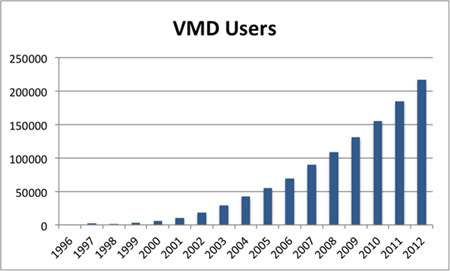
The steady rise in VMD users from 1996 to 2012. Figure created by Lisa Pollack.
But the efforts paid off. With the availability of VMD for Windows, which debuted January 2000, VMD essentially doubled its user base in one year. Even though the software could claim roughly this twofold increase, Schulten still felt pressure from his granting agencies for the modest 6,000 users he claimed after the first year of the new millennium. He says the funding agency asked hard questions in the early days, but thankfully was patient. And VMD usage continued to rise year after year at a very steady rate, as shown in the graphic. By 2012 the number of users had risen to 217,000.
Why the meteoric rise in popularity? Schulten claims his group did not do anything systematic to sell VMD, and that the program really sells itself. “We would have loved to do it,” he says of marketing VMD, “but we didn't know how. We were scientists and not salespeople.” Nevertheless, Schulten can point to some factors that he believes increased VMD's following. First, through the careful efforts of Stone and Schulten, funding was continually secured from outside sources so that VMD could be offered free, to all. And second, since Schulten's group employs VMD and NAMD all the time in their work, he believes that these tools get exposure through normal dissemination of their research. “I think there's something we did to advertise, but we didn't do it consciously,” Schulten explains. “But it was really powerful, and that is we are not only developing software, we are also doing science. And we use it in our own science.” And finally, since 2003, the scientists in the group have been training others to use VMD in workshops and summer schools across the globe. “I have trained personally over a thousand people,” Schulten concludes.
The rise in popularity over the last decade can also be attributed to unique features that distinguish VMD from other similar software. For example, from its outset the program focused on displaying dynamic data, which filled a niche in computational biology at the time. John Stone, the software's primary developer since 1998, who possesses extensive knowledge about the myriad scientific visualization tools available elsewhere, also believes other features set VMD apart and have contributed to its widespread use. For example, to view just a part of a structure displayed on screen, it seems natural to select that part with a mouse and zoom in. But VMD has a sophisticated feature for atom selection. Stone explains that there is a little text box, similar to a web search engine, where a user types a phrase adhering to a special syntax, and VMD then finds the atoms that meet the criteria and displays them. For instance, “protein within 5 of nucleic” and “not protein” are possible user queries. This feature, atom selection language, which is not as easy as just clicking on a region with a mouse, requires users to learn a syntax but offers a host of benefits. “The selection feature of VMD is unique,” Stone conveys, “and what it means is you can rapidly select something that you cannot see or you cannot pick graphically.” This applies to molecules like proteins, which may be contorted or intertwined and the desired atoms may not be visible in the viewer window; or it may be impossible to use a mouse to select just one atom without selecting its neighbors.
“The other thing that's nice about the selection language is you can apply the selection to things with a hundred million atoms, and it's no problem,” Stone notes. “Whereas, can you imagine trying to pick stuff out of these hundred-million atom structures?” VMD matured over the years to handle larger and larger systems, mainly because Stone was constantly implementing new algorithms and rewriting slow parts of the code; and the atom selection feature became an asset to viewing such large structures. The early developers of VMD, Bill Humphrey and Andrew Dalke, never envisioned the use of VMD with multi-million atom structures, according to Humphrey. But Humphrey cites two reasons that influenced his decision to use atom selection. First, he was motivated by the needs of his own research project on bacteriorhodopsin. “I constantly needed to highlight various sections to create images for papers, or to highlight the amino acids around the retinal area, or even to select particular amino acids by their backbone location,” recalls Humphrey. His second influence on atom selection came from another program popular at the time, Axel Brunger's X-PLOR, a program for NMR structure determination. Humphrey believes it had some kind of atom selection that he found useful. The other early developer of VMD, Andrew Dalke, revamped the initial atom selection feature to support a much more expressive and functional syntax.
The poliovirus, as illustrated with multiple representations. The capsid of this virus is shown in blue, and its interior is highlighted using atom selection.
On a Parallel Path with Technological Advances
While certain features, like the two mentioned above, make VMD unique in the world of software, the popularity of the program also likely stems from its consistent incorporation of the latest technology. Schulten firmly believes that technological innovations offer opportunities for researchers to improve the science that they do or turn the impossible into reality. With John Stone as a partner, Schulten has grown closer to his goal of using technology to elucidate living systems. “He is a good leader who is always looking beyond the next sort of edge,” Schulten says of Stone. “He looks into the future and has an idea of where it's really heading.” Because technology moves so quickly, Stone and Schulten need to be consistently alert. Yet Schulten reiterates that they do not incorporate the latest technology so much to compete, but rather to enable discovery–so scientists have the best and newest tools in their arsenal. “The program is moving so fast that VMD is more a process than a result, more than a piece of written software,” concludes Schulten. And for almost twenty years, this progression of VMD has often paralleled technological advances in both software and hardware.
Surprisingly, a technological development that benefitted VMD from its outset was the computer mouse. John Stone recalls the pre-mouse days when computer graphics terminals actually manipulated the molecules on the screen with a device called a dial box. “A dial box had six or eight knobs that you would turn, and each knob would rotate the molecule on a different axis or would translate it or scale it,” he remarks, speaking from experience. Luckily, the high-end graphics workstations that Bill Humphrey used in the first years of VMD already employed a mouse to interact with software. Many graphics programs, for example ones doing X-ray crystallography, in this time period of the early 1990s actually pre-date mice; instead of menus for interacting with the software, one might type strings of commands at a prompt. This utilization of the mouse separated VMD as a survivor for two reasons: First, many existing graphics programs at the time did not employ menus for interacting with the software, and failed to make the transition to mouse-based user interfaces. And second, as John Stone points out, “just the way you interact with the software is a key to who is able to use it.” The mouse made VMD comparatively easy to use relative to other programs of the time. While the computer mouse is one way to interact with a program, the proliferation of touchpad screens, such as those in phones and tablets, is not far from the thoughts of the developers of VMD these days. In Klaus Schulten's group developer Kirby Vandivort is undertaking the challenge of designing a VMD version to work on touch screens, the newest way to interact with a device.
VMD Embraces the Graphics Processing Unit
While the mouse is one technological advance that truly marked VMD as a survivor compared to other programs, since its inception the program has kept pace with graphics hardware development; stereoscopic display and six degree-of-freedom input devices are just two of the myriad features that VMD supports. But one technology has really expanded the impact of VMD: the modern graphics processing unit, or GPU.|
"TO ME THIS WAS LIKE THE HOLY GRAIL." John Stone |
VMD has always utilized GPUs, or graphics accelerators as they were called in their early days, to draw scenes on the screen. Demand for better and cheaper computer graphics capabilities, for example in the world of gaming, really escalated the development of sophisticated GPUs. Now the modern GPU is a “dual friend” to VMD, according to Klaus Schulten. Not only does it provide graphics power for viewing complicated molecules on the screen, but VMD also uses GPUs to do parallel computing and calculate physical properties that either took too long or were not even possible before. The modern GPU, a general-purpose processor now, is no longer just for display.
What makes the GPUs so unique is that they are comprised of multiple processing units capable of being programmed. “And once the graphics was done by programming, instead of by hardware,” Stone clarifies, “that began an evolution from about 2001, the beginning of the real heyday, up to now.” To get benefit in VMD, users just have to buy a GPU for their machine, which is not costly like buying a graphics workstation in the 1990s worth $50,000. “GPUs make something that was either not interactive or would have required a whole cluster of computers to do,” Stone explains, “and now you can do these tasks on desktop machinery or even a laptop.” Not only does Stone take advantage of hardware breakthroughs to speed up calculations in VMD, but he is also keenly aware of software technology as well, especially as it applies to GPUs. “So every six months I would say, people are setting new records for the speed of certain widely used and well-understood algorithms,” declares Stone, “things that we take for granted, like searching, or sorting, or adding numbers, or matrix multiplies.” Stone is constantly incorporating new algorithm breakthroughs into the backbone of VMD.
“I've wanted to do this for so long, to me this was like the Holy Grail.” John Stone grows animated as he talks about one of the newest capabilities in VMD made possible with GPUs. “I must have had this question a thousand times: What would it take to be able to show surfaces while I'm playing my trajectory?” For a decade he had to answer requests in the negative. But Stone, ever vigilant about how new technology could benefit VMD, saw the opportunity present itself around 2007, when GPUs grew sophisticated to the level that he deemed necessary for success.
Early capabilities in VMD could draw surfaces for molecules, but only for static structures; since one aspect of the computational microscope is that it elucidates moving detail that can't be captured with any other experimental microscopy, there was a big push to show surfaces for animated molecules. Stone had a proof of concept from little prototypes for animated surfaces he had developed over the years, but Stone and Schulten decided to take a big risk and see if they could conquer the surface problem once and for all. “This is, to me, a prime example of why I like working with Klaus,” explains Stone. “That's what makes it fun for me, being able to do new things, and exploit new technology to do things that weren't possible before.”
How did the developers of VMD utilize GPUs for showing surfaces of million-atom moving structures? While visiting Germany, Schulten talked to Thomas Ertl, head of a very famous visualization laboratory in Stuttgart, and discovered that Ertl's group had also done some very interesting work on GPUs. A student from Ertl's lab, Michael Krone, came to Illinois to join forces with Stone. Working solidly for three months, Stone and Krone tackled the problem together. The result was “QuickSurf,” a surface representation tool in VMD, which not only worked for huge structures over a million atoms, but also allowed users to interactively control the simulation as it was playing, to display more or less detail about the system. “Before, viewing molecular surfaces was always very abstract and slow, whereas in my mind I saw them moving. Now I see live molecules in front of my eyes,” Schulten says about QuickSurf. “And suddenly everything became extremely natural, rather than abstract molecules shown in some abstract means.” The QuickSurf feature debuted in February of 2012.
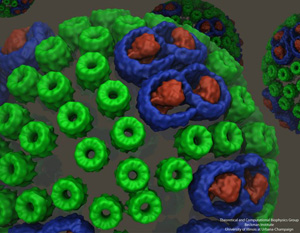
An example of an image created with QuickSurf. A chromatophore vesicle, important in photosynthesis, from a purple bacterium.
Not only do GPUs benefit calculation of molecular surfaces, but other features in VMD have been given a boost as well. Display of molecular orbitals, important in the field of quantum chemistry, and computing and display of electrostatic fields around molecules are only two examples of how GPUs have benefitted VMD. Before GPUs, the molecular orbitals required batch mode calculations on a cluster or overnight in order to display a movie; in addition, the user wouldn't have been able to change the parameters of what they were shown on the screen without recalculating those things from scratch. In these examples, Stone sees the GPU providing a speed increase of a factor of a hundred compared to the CPU, the central processing unit that has traditionally been the workhorse of the computer.
VMD has kept pace with technological advances, in both hardware and software, and this has really defined the program's maturation. The developers over the years have incorporated, among many innovations, new display and input options, GPUs, and cutting edge algorithms. But a robot that literally knocked Klaus Schulten off his feet was responsible for a feature in VMD that Schulten hoped could open new doors of analysis for his large biomolecules.
Pulling on a Molecule that Pulls Back
Computer scientist Frederick Brooks describes his chance encounter with the man who designed the manipulator as providential. In the 1950s, at Argonne National Laboratory near Chicago, Raymond Goertz and his group developed the ARM, the Argonne Remote Manipulator, a force-feedback device used to manipulate radioactive material in contaminated areas unsafe for humans to enter. Users gripped a device and moved it with their hand, and then signals were transferred to a robotic hand inside the contaminated area, which the users could see through glass. In the late 1960s or early 1970s Brooks met Goertz, the primary developer of the ARM, and Goertz arranged for Brooks to receive a manipulator that was no longer in use.
A computer scientist at the University of North Carolina at Chapel Hill, where he founded the computer science department in 1964, Frederick Brooks was interested in how interactive graphics could aid the study of molecules. He started a lifelong project in 1967 to uncover how to not only see a virtual world of molecules, but also how to feel it. While trying to use the donated remote manipulator with a computer in the 1970s, Brooks realized that he needed at least a hundred times more computer power than was feasible at the time, and he sidelined his work with the ARM until 1986, the arrival of the VAX computer.
An example of using VMD for Interactive Molecular Dynamics. Paul Grayson looks on as John Stone manipulates a molecule with a haptic device. Photo circa 2001.
The group in North Carolina then started various projects using the ARM. One of the projects to come out of their research was molecular docking, especially useful to understand how drugs bind to receptor sites on proteins. In their design, the ARM was used to not only move a small molecule on a computer screen towards its docking site, but users of the ARM could actually feel the forces on the molecule as they tried to dock it to various places on a protein. This was an early application of a haptic device in molecular graphics, for the ARM received forces from the computer and transmitted them to the user. In a 1990 article summarizing his molecular graphics work, Brooks described how chemists who tested his system, both with and without haptic feedback, did much better when they could also feel the forces while viewing the molecules for docking.
Klaus Schulten remembers vividly when he got to use the ARM, while visiting North Carolina. He claims he was warned to be attentive, as it was a strong robot he was going to be using. “I was careful, but you know the first time I used it I was taken by surprise,” Schulten says of the ARM. “I wasn't thrown across the room, but I definitely fell backwards.” While the forces may have thrown him off balance, the experience left a lasting impression on him for another reason: haptic feedback could be a boon to his research.
In the early history of VMD, as far back as 1992, one of the features the software incorporated was doing molecular dynamics interactively; VMD could hook into a running molecular dynamics simulation and, through a three-dimensional pointer, transmit forces to act on the molecule in question. By the end of decade, Schulten and Stone, inspired by Brooks's work in North Carolina on the ARM, realized that affordable haptic devices were making their way onto the market and could be used with VMD. Instead of using a mouse to pull on an atom, it made sense to use a haptic device to pull on an atom in a molecule so the user could feel the forces the atom was experiencing when a pull or rotation was applied. John Stone collaborated with graduate student Justin Gullingsrud to get a haptic device, called the Phantom, to work in real time with a running molecular dynamics simulation. In a 2001 paper by Stone, Gullingsrud, and Schulten, they described their first attempt to use a haptic device with VMD and termed the process Interactive Molecular Dynamics.
Schulten was not only inspired to use haptic devices by his experience in North Carolina, he was motivated by another factor–the limitations of steered molecular dynamics. In steered molecular dynamics, pre-defined forces are applied to a system, a batch job is run in a program like NAMD, and a week later results are obtained. A user might wish to stretch the end of a protein, or pull on a small molecule that is bound to a large molecule. In Schulten's group, to name one example, researchers used steered molecular dynamics on the protein titin to study its elasticity, as it is believed that elasticity in muscle comes from this large protein.
For applying forces or torques to molecules under study, Schulten sees many reasons to get VMD into the act. First, by using his own judgment, he could apply forces interactively as the simulation evolves. With VMD he could not only see what was going on, but also he could actually feel the compliance. Second, it is often complicated to pre-define the forces, which is the case with steered molecular dynamics. And third, when faced with a new molecule, he would like to tinker with it to understand it better. But Schulten likens pulling out a small molecule bound to a large molecule to the task a dentist faces pulling out a molar from the jaw. The dentist starts pulling in one direction, but then has to change the direction of pull several times based on what feels easiest as the procedure advances. Schulten would like this flexibility the dentist has when working with his molecules.
However, Schulten and Stone both acknowledge that interactive molecular dynamics in VMD, using current haptic devices, is still not ideal, even though this concept of interacting with a live simulation has been part of VMD for almost twenty years. As Stone sees it, the feature does not have an intuitive interface yet. “You would like to have the opportunity to deal with macromolecules as natural objects, which you can literally manipulate as if your hand were the size of an atom,” reiterates Schulten. Turning the puck of a Spaceball or manipulating a haptic stylus is not the same as having tactile input at the fingertip level of detail. Nevertheless, honing interactive molecular dynamics is still an ongoing process for the developers of VMD. “We will do the best that we can with the devices that are actually available, that exist, and that are affordable,” Stone declares, “and find better ways to use them.”
Adaptability and Flexibility
VMD is not strictly from the minds of creators, for it is based on the availability of commodity technology, like GPUs or input devices; the development of VMD over the years somewhat parallels developments in software and hardware. Yet, another aspect of VMD has contributed to its maturation and popularity–making the program adaptable enough to satisfy needs of users, needs that its developers could never imagine. “Not all eventualities can be foreseen when you release a software product, so you have to give the user flexibility,” Schulten reiterates. From its inception, VMD came with a built-in scripting language, a feature that gave the user options to extend the analysis capabilities of the program. Another facet of VMD that illustrates built-in flexibility involves the use of renderers.
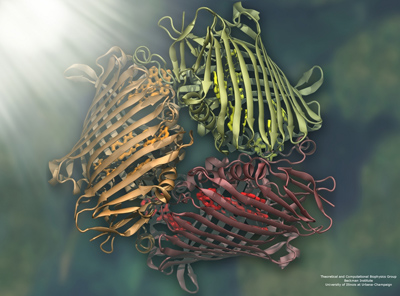
An example of an image rendered in VMD. The Fenna-Matthews-Olson Trimer.
For viewing molecules on the computer screen, VMD uses the OpenGL renderer to animate and rotate a molecule. While fast enough to be interactive and animate a scene, it is not necessarily the one to produce publication-quality graphics. In order to generate a scene that looks photorealistic, VMD has a parallel renderer called Tachyon, which John Stone wrote in his graduate school days. “You have to then use much more sophisticated algorithms and mathematical techniques to simulate the physics of lighting,” says Stone on why renderers require time to work. “It becomes a computer simulation of its own, to make a picture of what you would see if there were lights in all these positions, etc.” These complicated mathematical techniques are not employed in OpenGL because the goal there is to provide real-time image generation, or more of a sketch, as Stone likes to say.
Tachyon has many advantages. For one, it is free and built-in. And Tachyon has a feature, ambient occlusion lighting, which many other renderers do not. Stone wrote the OpenGL code and the Tachyon code, so they both generate images that are almost the same. The differences are because Tachyon uses complicated mathematics and algorithms, so will produce shadows and reflections and things not seen in the OpenGL display. And Tachyon is parallel, hence fast.
But as with many features of VMD, there is flexibility in rendering. VMD can output scene files for use with many popular external renderers, such as Pixar's RenderMan. While Stone says he does not expect a single user to need fifteen different formats, he feels that a user might want to combine a VMD image with some other scene. “If you want to zoom out to the solar system for some reason and show bacteria on some imaginary planet somewhere, you're going to do that with an animation tool, not with VMD,” clarifies Stone. So a user can incorporate graphics from VMD with other images and build a scene with many external renderers. VMD even outputs a file format for three-dimensional printing. Called stereolithography, a user can generate a specific file, send it to a 3D printer, and then end up with a plastic molecule.
Stone is clear to point out Schulten's influence when it comes to rendering photorealistic images suitable for publications. While the initial version of VMD had a feature that allowed the user to download an external renderer for use with VMD, it was slow and required some technical finesse to get it working. Schulten advocated for the generation of publication-quality graphics to be made easier. So Stone incorporated his renderer Tachyon right into VMD, and eradicated the need to download an external program. He had written Tachyon in graduate school as a parallel ray tracer, but he still exerted a great deal of effort incorporating it into VMD, to allow users to simply click on some buttons to render an image. But his efforts created a much better user experience, as rendering was now fast and painless and produced a level of detail that really brought the molecules to life. “When I wrote this code to implement Tachyon, and I put these buttons in VMD, and I spent all this time sorting that out, I had no idea that people were going to make such inspiring looking images,” summarizes Stone.
Expanding to a Wider Audience: Plugins
“I guess I view VMD as being like a web browser,” remarks John Stone. “It ought to be able to load anything I want to see.” But in its early incarnations, this was not always the case. When VMD was in its infancy, it focused mainly on the needs of the scientists in Schulten's group; the image and trajectory files those scientists animated were a limited number. But as VMD gained popularity, outside users were generating all sorts of data that they wanted to visualize using VMD, from programs like X-PLOR, Amber, and CHARMM to name but a few. John Stone realized, after many years of recompiling the entire code each time he added capability for a new image file, that he needed a more streamlined approach to make VMD aware of new file formats. It was clear to him that VMD needed to display all the alternatives out there, and that many more would appear in the future as well. His solution was to create plugins, little programs that VMD could access for recognizing a new format, which eliminated the hassle of rewriting the entire code. Stone worked with a series of undergraduates at the university over a period of several years to expand the range of what VMD could view. While the undergraduates got training and a bit of spending money, VMD broadened its usefulness to a wider audience
Chris Mayne, a scientist at the University of Illinois who has contributed many plugins to VMD.
While making VMD read the myriad files users could possibly generate helped cement it as a flexible visualization tool, the eradication of an original capability, born out of necessity, eventually led to a way for average users to contribute to VMD, and thus enlarge its domain of available features for everybody.
As mentioned earlier, one of John Stone's earliest tasks as the new lead developer was to port VMD from expensive workstations to PCs, which involved intense rewrites of the base code. An issue he encountered from this porting effort was that the graphical interface, which operated smoothly on the powerful Silicon Graphics workstations on which VMD was designed, did not always function in the same way on PCs. In fact, some aspects of the graphical interface did not work at all on these less powerful machines. One of those features allowed users to add a simple script they wrote to a pop-up menu, to essentially create a button for a repetitive task specific to a user's needs. But this pop-up menu was not working on the personal computers.
At this point, Stone converted a problem into on opportunity. He came up with the idea to add a special “Extensions” menu, which would be populated with plugins created by the user community. He was working with graduate student Justin Gullingsrud at the time. “At that point,” Stone comments, “we realized there was this possibility to open up the program to do things other than just show 3D structures.” Stone hoped that by providing a formal mechanism for users to contribute plugins to VMD, the capabilities of VMD would extend beyond the realms of knowledge of the software's developers, and give VMD a broader appeal. While it took considerable effort by Stone to fashion a way for users to add their own plugins to VMD, the idea eventually caught on. Initially Stone and Gullingsrud had two or three plugins in the Extensions menu when the feature debuted in 2003, but now there are over 90 known plugins for users to access. Some of those include: RMSD features for measuring bulk movement of proteins, plugins for building membranes or molecules, tools to determine symmetry point groups, and animations for dipole moments.
Stone's vision, of expanding VMD with the help of scientists who aren't strictly software developers, is really exemplified in a recent plugin called FFTK, or Force Field Tool Kit.
Chris Mayne did not start out intending to design plugins for the community to use; his route was a bit more circuitous. He worked in the experimental group of John Katzenellenbogen, doing synthetic organic chemistry while a graduate student at the University of Illinois. One particular project involved synthesizing agents that selectively bind to the progesterone receptor as a possible indicator of breast tumors. Seeing how these agents bind, or dock, to the receptor could ultimately help in the diagnosis and treatment of breast cancer, as these agents are a type of radiopharmaceutical. But he was not strictly at a bench the whole time doing docking studies. “These days a lot of medicinal chemistry labs, and particularly the one that I worked in, like to use modeling to inform our synthetic approaches,” Mayne explains. In the lab's exploration of what compounds dock to the progesterone receptor, one of Mayne's roles was to look at how possible agents, small molecules called ligands, bind to a crystal structure, and he would simulate docking on the computer first to help them think about their ligand designs. “So I had experience with molecular editors, and docking algorithms,” says Mayne. “And I like to push technology as far as I can.” He relays that he started writing scripts, and to get results he needed, he “kind of abused some programs in that way.”
Mayne started scripting in VMD when he transitioned to a postdoc position at the university, working jointly now for his former graduate advisor and biophysicist Emad Tajkhorshid. One day when faced with the dilemma that an ion he needed was not already in VMD's ionization plugin, he explored the code and altered it for his needs. “So this helped me appreciate the symbiosis between Tcl and VMD,” states Mayne. “And how you can convince VMD to do some very complicated things using a very simple language.”
In Mayne's postdoc, he is still interested in simulating how ligands, be they small molecules or novel drugs, bind to proteins. To run such simulations, parameters that define the numerous interactions between atoms of a molecule are required; these parameters (like force constants, charges, phases, and atomic radii to name a few) encapsulate the various forces on the molecule, and the collection of them defines a set of “force field parameters.” When Mayne needed force field parameters for a new ligand he wanted to simulate, he decided to generate them himself, in part by writing scripts in VMD. The process of force field generation is anything but straightforward, requiring multiple quantum mechanical inputs (such as geometry optimizations, harmonic frequency calculations and optimized water interactions); thus began a long odyssey for Mayne.
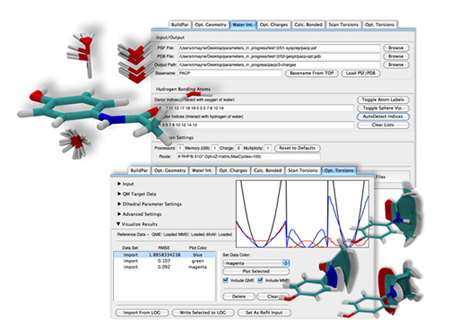
The graphical interface of Force Field Toolkit, a plugin designed by Chris Mayne and J.C. Gumbart.
Along the way he combined forces with James “J.C.” Gumbart, who was also independently wrestling with how to create parameters that did not already exist. Gumbart is a former member of Klaus Schulten's group who visited Urbana occasionally from his postdoc up at Argonne National Lab, also in Illinois. For a task as complicated as this parameterization, Mayne says his own strong organic chemistry background pairs well with Gumbart's simulation-oriented background, and the two form a strong team. In 2010 a group in Maryland released what is called the CHARMM General Force Field, which included not only a small set of biologically relevant compounds and their parameters, but also the codified steps or the workflow for determining parameters. Mayne and Gumbart used the principles and the outlined workflow as a guide in their own project. And one of their basic tenets all along was to take the tedium out of the process of parameterization. “The scripts themselves weren't sufficient to make it easy, so we ended up making a plugin and a graphical interface to make it even that much easier,” concludes Mayne. They called the result Force Field Toolkit and it debuted in 2012 in VMD. The pair continued to refine it and make it faster, however, and their upgrades will premiere in VMD's next release
But the scripting bug has truly bitten Chris Mayne. One day while sitting in his office he overheard a professor complaining about the automatic presets that come with VMD, which do things like set all the carbon atoms to cyan or designate the background color. Mayne, at that point, was so fluent in the ways of VMD that he realized that this professor needed to change some code in a file to get VMD to look different. “And I thought,” says Mayne, “this is kind of a lot to ask of a casual user.” So Mayne developed a plugin with an interface to allow users to select settings they desire, and every time VMD starts up, their preferences materialize, for Mayne's script tells VMD how to behave without the user needing to do any coding themselves. Called VMD Preferences, this plugin is set to debut in the next release of VMD; and it's not just for a casual user, relates Mayne. Power users can define multiple settings, and select between them, if, for example, they have one category of settings for looking at a particular molecule and another category for generating publication-quality graphics. With the contribution of not one, but two plugins by Chris Mayne, it seems like developer John Stone's overall idea to get interested users to expand the capabilities of VMD came with a big payoff.
The Quest to Represent Larger and Larger Systems
“In a typical human cell, you have about as many proteins as the United States has citizens,” says Klaus Schulten. “They sort of form societies, from families to villages, to cities and states. And then only with the whole country you are getting the smallest living entity, the cell.” These societies in a living cell comprise hundreds of millions of atoms, and to represent this biological organization, the tools of the computational biophysicist need to portray millions of atoms efficiently and interactively. Schulten's quest to simulate a living cell from its constituent molecules has been one of the guiding forces over the years that propelled him to tackle visualization of huge systems with VMD.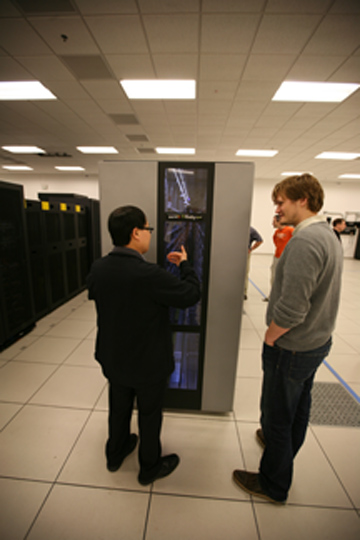
Haley Mui and Johan Strümpfer take a tour of the Blue Waters supercomputer housed at the University of Illinois.
As system sizes swell, simulation software running on supercomputers is producing molecular dynamics trajectory files, for example, that are thousands of gigabytes. It is becoming increasingly impossible to transmit data for examination to a user's desktop machine. But VMD is adapting–by learning to run in parallel and work on supercomputers. Stone has ported VMD to many supercomputers so users can analyze their data that are too big to move off the supercomputers, or to do the analysis more quickly than what is possible on a desktop machine or even on small clusters.
One supercomputer that now runs VMD is housed nearby on the University of Illinois campus at the National Center for Supercomputing Applications (or the NCSA, the place where VMD got its 1992 start as the virtual reality software). Named Blue Waters, Stone says that porting to this petascale machine running Linux was straightforward, though he worked for a long time getting VMD to run in parallel. But the efforts paid off. John Stone and Johan Strümpfer, a graduate student in Schulten's group, combined efforts and made a movie of a three-million-atom chromatophore structure rotating. While the process would have taken thirty days on the most powerful graphics computer in the group, rendering the movie on Blue Waters took roughly 22 minutes.
One of Life's Greatest Mysteries
The University of Illinois at Urbana-Champaign is a large school. But at this institution that straddles two cities, several instances of serendipity would occur over the course of several decades that led, both directly and indirectly, to a popular feature of VMD added in 2005-2007. This feature makes it possible to look more critically at one of science's biggest questions, the evolution of life.
One of the first instances of fortuity in Urbana was that Carl Woese had a laboratory just down the hall from colleague Ralph Wolfe in the Department of Microbiology at the university. Since 1964, when he joined the faculty in Illinois, Carl Woese had focused his attention on the RNA in bacteria, because he was trying to understand the origins of life. He felt that ribosomal RNA could help him trace out evolutionary paths since he suspected that this rRNA changed slowly over time. He was focusing his attention on just a segment of the rRNA (called 16s rRNA), because it was known to be highly conserved in bacteria. Instead of characterizing bacteria by their shape or metabolism, as many biologists had tried to do, Woese was looking at the sequence of the rRNA segment, charting out the code which was comprised of four building blocks: A, C, G, and U (for adenine, cytosine, guanine, and uracil). He was effectively generating sequence data for thousands of bacteria.
However, this continual production of sequence data was tedious. Woese would use a sequencing technique pioneered by Fredrick Sanger, which generated a sheet of photographic film with rows of black shadows. Woese would then read the sheet with the aid of a light box. Doing this for thousands of microorganisms, Woese gained a feel for which ones were related to each other evolutionarily, because he saw that they had similar signatures.
While Woese was toiling away in obscurity, developing a taxonomy for bacteria, which scientists at the time claimed was impossible, he started talking to his colleague Ralph Wolfe in the spring of 1975. Wolfe was studying peculiar organisms at the time, and the two men wondered where these organisms would fit on the taxonomic tree Woese was developing. Since the university was a land-grant institution, it had an agricultural division, which would turn out to be fortuitous for Woese and Wolfe. Right on the university grounds Wolfe collected samples of organisms living in cow manure and cow intestines which were called methanogens, since they produced methane.
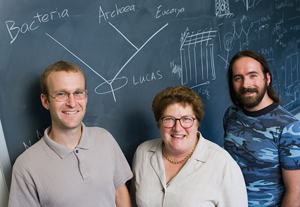
Elijah Roberts, Zan Luthey-Schulten, and John Eargle, some of the developers of MultiSeq.
Woese sequenced these methanogens and their signatures did not match any of the hundreds of bacteria he had already sequenced. This would lead Carl Woese to propose in 1977 a new domain of life, the archaea, and he would totally rework the tree of life to contain three branches instead of two. Although now almost universally accepted by the biology community, this radical proposition at first was met with skepticism and scorn, and the story of how it grew to be accepted, and how Woese slowly received the recognition he deserved, is covered at length in other articles and books. Suffice it to say that in 2003 Woese received biology's highest honor, the Crafoord Prize in Biosciences, among his many accolades. He continued working in Urbana until his death in early 2013.
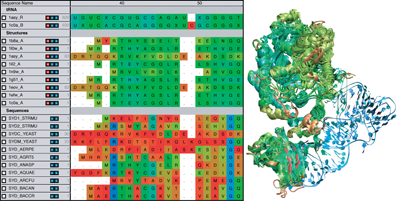
At the University of Illinois since 1987, Zaida “Zan” Luthey-Schulten, now the William and Janet Lycan professor in Chemistry, was studying protein folding in the 1990s and realized she needed to learn about bioinformatics to make her research on protein folding more fruitful. In a nutshell, bioinformatics is collecting, storing, and analyzing sequence data; the sequences can come from RNA, like what Carl Woese produced for decades, or from proteins or genes. Scientists try to align similar sequences and then produce phylogenetic trees of those sequences, to give a sort of evolutionary picture of how sequences are related to each other.
Luthey-Schulten realized that she needed input from an evolutionary biologist to cement her understanding of bioinformatics. In the great lattice of coincidence, when she asked around about who studied evolutionary biology on campus, she was directed to Carl Woese, probably the most eminent evolutionary biologist at the university, if not in the nation. Luthey-Schulten came to realize many things from her discussions with Carl Woese, who showed her the comparative tools he used to study genomes and RNA from organisms spanning all three domains of life. In her protein folding work, she began to more effectively use protein sequences to establish training and test sets for protein folding energy functions. But this exchange also had a more profound effect: “I cannot stress it enough,” says Luthey-Schulten about research, “that putting it in perspective of evolution, you gain so much more from it. Because at the bottom line, we're all the result of evolution. I think you owe it to yourself, when you're doing your research if you can, to put it in a slightly broader context.”
While her talks with Woese were influencing how she approached her research, she realized something else as well: “The graduate students needed better tools to study and compare sequences and structures, and map them back and forth between alignments and available structure,” Luthey-Schulten remarks. Out of this need would come a new piece of software that would eventually make its way into VMD.
“Everyone always makes these jokes: Oh, I have software but it stops working the minute the student leaves,” declares Luthey-Schulten on a common problem, especially for theoretical research groups. “It's not a joke. You hate it, because there's no way of passing on what's been done, if everybody has to stop and reprogram it.” With her graduate students, Elijah Roberts, John Eargle, and Dan Wright, Luthey-Schulten started crafting a tool that could load structures of proteins and RNA and do a bioinformatics analysis on them. Traditionally, bioinformatics has looked at sequence data, but the group wanted to specifically bring in structure data as well. As fortuity would have it, Zan Luthey-Schulten was well aware of the gradually expanding capabilities of VMD, as her husband and collaborator is Klaus Schulten. She says it was an obvious decision to include her group's efforts on bioinformatics tools in VMD. Thus in 2005, with considerable effort by the graduate students and VMD developer Kirby Vandivort, a new plugin appeared in VMD, called MultiSeq. Pronounced “multi-seek,” this addition to VMD allowed researchers to edit and align structure data, and even generate phylogenetic trees. Soon MultiSeq would bring in sequence data as well.
“I will tell you one thing that's behind the development of anything that goes into the software that my group contributes,” notes Luthey-Schulten; “it is that they are solving some science problem. And then to do that, they have to develop a new tool. And then if it looks like it works, I always say: If it's good for me, then it's probably good for the rest of the community.” Shaping and refining the features of MultiSeq came from many studies on synthetases that Luthey-Schulten took part in. The synthetases, a type of enzyme that has been around for billions of years, play a key early role during the critical process of protein formation in a cell. Carl Woese was a major collaborator on this synthetase work with Luthey-Schulten.
The MultiSeq plugin displays the editor on the left, with the corresponding structure on the right.
“So much of the logic that we use for MultiSeq and VMD was motivated by interacting with Carl Woese,” conveys Luthey-Schulten. One of the main tools of MultiSeq is a powerful editor for viewing the components of a sequence or structure. The image at left shows a view of the editor, which has sequence or structure entries in the rows; a user can see the structure or sequence components in the editor and view the actual structure that corresponds to it, at the same time. When Luthey-Schulten first started talking to Carl Woese about an evolutionary approach to her work, Woese was using an old editor that only operated on a Sun workstation with its unique keyboard. But it had many good features that Woese liked, which the Luthey- Schulten team incorporated into MultiSeq. "Something most others can do is move gaps around," notes John Eargle on the alignment editors available these days. "They can move entries of a sequence around, but they cannot delete an entry. Or they couldn't change an amino acid in a sequence from one to another, and that is something you need to do sometimes." It is also possible to load many sequences from different systems and group them separately in the editor.
One of the strengths of MultiSeq is the ability to cull all the information on the web that exists about a structure or a sequence. Some types of this information might include: enzyme name, enzyme classification, or the full lineage of the organism that the sequence or structure is from. Another key feature of MultiSeq is its ability to generate phylogenetic trees from both sequence and structure data. Editing the trees is a unique feature of MultiSeq. “You can do a lot with the tree view,” clarifies Eargle. “You can change the labels at the end, or you can color by domain of life.”
The MultiSeq plugin of VMD has grown in popularity since its debut in 2005. This feature has made VMD even more versatile, as it expanded its use into the bioinformatics community. And it even garnered praise from a veteran who had looked at sequence data his whole life. As Carl Woese once remarked to Luthey-Schulten, “VMD is far from a simple visualization tool for biologists. It is a true thinking tool. Without it a whole class of biological hypotheses would simply not exist.”
VMD in the Classroom
While VMD is designed mainly as a tool to enable scientific research, some are using it with success in the classroom. Teachers are employing it not just in the university setting, but in middle school and high school as well.“The ultimate goal would be to make learning science more like doing science, more like being a scientist,” says Sharlene Denos, about the mission of her work in middle schools and high schools. Denos works as the K-12 Outreach Coordinator at a University of Illinois resource called the Center for the Physics of Living Cells. The center does outreach to both the scientific community and the kindergarten through high school community, focusing on dissemination of physics concepts as they relate to biological cells. Denos is at the helm of the K-12 outreach aspect, and she works both with teachers and students. “For my part the mission is to connect the K-12 teachers and students with resources at the university,” Denos explains, “and not just the resources, but also the science.”
In her role at the center, Denos not only brings in high school and middle school teachers for workshops and training, but she goes into the schools in the area as well, working directly with students. The twin cities of Champaign and Urbana are located in central Illinois, about 120 miles south of Chicago. Denos's work focuses on schools in a radius around Champaign-Urbana, many of them rural schools without resources like their richer counterparts upstate near Chicago.
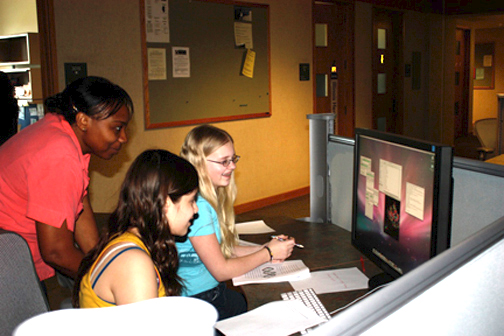
Seventh grade girls unmask molecular biology with VMD, through outreach efforts by the Center for the Physics of Living Cells.
Trained with a PhD in biophysics, and also awarded a National Science Foundation GK-12 fellowship in graduate school, which is a program that enables graduate students to bring more science into the schools, Denos now develops lesson plans that teachers in high school and middle school can use in the classroom. Some of these lesson plans include: “Extracting DNA from Your Cells,” “Exploring DNA and RNA Structure,” and “RNA Polymerase.” With the latter two, Denos has designed a VMD component to accompany the lesson. “When the students are doing biochemistry-type topics in school, it's all reading,” relays Denos. “Essentially they just read about it, they memorize it, or they'll look at some pictures. But they almost never do any experiments; they almost never do anything hands-on at all. So our goal was to try to make something a little bit more hands-on.”
There are many hurdles to face when trying to use a cutting-edge research tool like VMD in a K-12 setting, mostly caused by poor funding of public schools. While the fact that VMD is free would seem like an advantage for a rural school district, Denos cites a common roadblock teachers in high school and middle school face: the teachers do not have administrative privileges for the computers they need to use for teaching. In fact, in one school district where Denos works, there is only ONE computer person for the entire district. Teachers have to go out of their way to get VMD in their computer labs. One way Denos gets around this is to bring in a stack of old PowerBooks to the classroom when she's teaching with VMD.
Another hurdle to using VMD in middle or high schools is that teachers near retirement age are not so comfortable learning new technology. Denos has to be persistent sometimes to convince some teachers that this new curriculum is worth their trouble. On the contrary, new teachers, who have grown up with computers as second nature, sometimes adopt VMD wholeheartedly and, for example, teach their entire department how to use the tool.
“One of the things that VMD allows you to do is to relate a little bit better to the molecule,” conveys Denos, “because there's no microscope that they can use to look at atoms and molecules.” Nevertheless, Denos points out that students in middle school, and many in high school, are just not developmentally ready for abstract thought. The concept of a molecule is hard to grasp for them.
But Denos observes that the students really love using VMD, and often figure out how to use its features even before she has a chance to explain them. In fact, often the students pick up the details of VMD more quickly than their teachers. Hopefully more resources like the Center for the Physics of Living Cells, with its many avenues of knowledge propagation, will bring cutting edge research tools to young students to give them a feel for what scientists actually do. With public schools waging a constant battle for resources, a free software program like VMD seems like an obvious choice to help teachers convey some of the wonderment of science.
User Overview
While VMD may be found in high schools, and even middle schools, that is only a small slice of the user community. According to a survey conducted in 2011 by Schulten's group, 94% of respondents use VMD for research, while only 4% use it for teaching. Looking at the big picture, there really is no typical user. However, Schulten is of the opinion that most people utilize the software to look at static structures, even though VMD was initially designed for dynamic data. Some users are serious and frequent, even designing their own scripts and plugins, and some are transient. Perhaps some only utilize VMD for a semester while in a class.
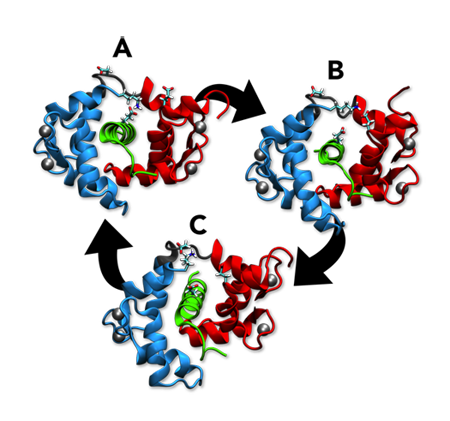
Transient salt bridge network in the calmodulin-neuronal nitric oxide synthase complex. Image courtesy of Dayle Smith.
Most users of VMD seem to work in academia (92%), but about 3% work for the government. One such user, biophysicist Dayle Smith, works at the Pacific Northwest National Laboratory studying electron transport in proteins. Smith fires up VMD every day, and has been using it since 2002, when she first encountered it as a postdoc. She typically uses VMD to visualize molecular dynamics trajectories of her proteins, which, when she strips off the water, comprise about 10,000 atoms. She likes the ability to make movies of the trajectories, and uses them both in presentations and as a way to communicate results to other researchers. “I also use VMD to make just still pictures of molecules,” relates Smith, “since it has nice rendering software in there to make publication-quality pictures.” As far as analysis, she uses VMD to calculate salt bridges and hydrogen bonds from her trajectories; she also uses the parameterization tool, Paratool, to develop force fields for metal clusters. While VMD is a daily part of her research life, she says she would use it even more if she could, as currently it does not read quantum chemical information from the chemistry package NWChem that she needs for parameterization.
Almost half of VMD users employ the software for biomedically relevant research. Of this subset of researchers in the biomedical field, about a quarter of them study protein conformation and function, and one of them is Sarah Rauscher, a postdoctoral scientist at the Max Planck Institute for Biophysical Chemistry in Göttingen, Germany. Her research there in the Department of Theoretical and Computational Biophysics focuses on disordered proteins. “An ordered protein, or a globular protein, usually adopts a single conformation,” Rauscher explains. “But a disordered protein is very different because it actually populates many conformations, and that's actually, in general, part of its biological function.” Ultimately her goal is to predict the many conformations of a disordered protein.Rauscher, who was first introduced to the software program in 2004, uses VMD almost every day in her work, looking at trajectories from molecular dynamics simulations and looking at different configurations of the disordered peptides. “VMD is well suited to very quickly look at trajectories from GROMACS,” notes Rauscher. “And it's very easy to make movies using the software.” She also appreciates how easy it is to customize the visualization of the proteins. “There are so many features that you can tune to your preferences,” says Rauscher. “For example, colors and materials, and different representations of secondary structure.” While tuning the parameters to make her macromolecules look just right is straightforward, it also is time consuming, and she would love a feature to streamline this process of customizing. And since she often needs to load and analyze two different protein structures in the same window, Rauscher would like to have more metrics at her disposal to compare the two.
While about 12% of VMD users describe their research as biophysics, the largest percentage of researchers (35%) come from the chemical sciences. One theoretical chemist using VMD is Aurora Clark, who runs a group at Washington State University in Pullman. With a background in F-element bonding from her postdoc, when she moved to Pullman she realized that lack of F-element force fields was a bottleneck to running molecular dynamics simulations on these species. So Clark started to develop force fields for the heavy elements. “That allowed us to start doing more molecular dynamics simulations,” Clark states. “And so my projects here at WSU are primarily associated with separations and environmental remediation, and kind of the fundamental behavior of solutes in solution.”
Because a large part of her research involves setting up, running, and analyzing density functional theory calculations to aid in her force field work, she estimates that her group uses VMD two or three times a week. “We use VMD a lot for the visualization of our data and also for wrapping and unwrapping simulation boxes,” conveys Clark. “And we've used it to calculate diffusion coefficients and things like that, to try and do more standardized analyses.” The group also makes movies with VMD, and Clark finds this extremely helpful for presentation purposes. “That's half of the battle, being able to convey your research to others,” Clark says. “And so for us personally that's a really nice thing, because there are very few other programs that have such a nice graphical interface.” Clark estimates her group has been using VMD for two or three years. “It's one of those codes where I think it takes a long time to get enough of a knowledge base to really use it to its maximum potential,” states Clark. “And I don't think we have yet. I think we're still kind of learning that.”
Conclusion: The future of VMD
VMD has existed in some form for twenty years already, adapting to new computers and new technologies all the while. Although the goal of VMD at first was to create a program that could display molecular dynamics trajectories, the software matured; its visualization capabilities for molecular structures expanded for both static and animated scenes. But in the last ten years, the developers have added analysis capabilities. “We used to just call it a visualization tool,” says John Stone. “And now we've started calling it a visualization and analysis tool.” MultiSeq is one example of a new analysis tool, as is generation of electrostatic fields around a molecule. VMD can also calculate spatial occupancy, and detect solids versus liquids, just to name a few of its analysis features.
While expanding VMD's analysis capabilities further is one of the goals for the future, Stone and Schulten have many more ideas brewing. With renewal of an NIH grant in 2012, Schulten's Center for Macromolecular Modeling and Bioinformatics at the University of Illinois has guaranteed funding to refine and enhance VMD for at least another five years.
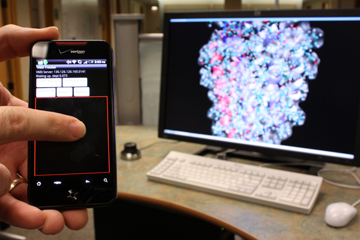
VMD controlled by a cell phone, an upcoming feature of the software program.
One of the goals in the coming years is to continue to teach VMD how to display and analyze larger and larger systems. For example, Schulten's group has a simulation of one hundred million atoms, so VMD is developing strategies to handle such colossal systems. The goal is to make the resolution of the images better and the viewing more realistic, so that rotating or zooming in on a structure of such size is seamless for the viewer. In addition to systems growing larger, trajectories from molecular dynamics are lasting for longer and longer times, some even for an entire millisecond, such as in the latest protein folding simulations. VMD is learning to analyze massive amounts of data from such simulations, to hone in on the interesting features; with such lengthy trajectories that might take days to view, the naked eye cannot be expected to discern every unique feature. But VMD can play a role in this task, by picking out what is important.
VMD is also slated to keep pace with the latest in technology. Graphics chips just keep improving, and VMD will continue to exploit these advances. While users currently interact with VMD by moving a mouse connected to their computer, items like cell phones and tablet computers now employ touch screens to interact with the devices. VMD is keeping pace with this new trend and its developers are making a version to work on a cell phone, which requires re-envisioning how the user tells VMD what to do. Another thing VMD is exploiting is solid state hard drives, which would make it possible to load huge trajectory files into VMD in mere minutes.
With so many users, Stone sees this base of people as critical to the future of VMD as well. “Our goal now is getting everybody else in the community to contribute to VMD and help each other as well,” summarizes Stone. With over 27,500 users registered for the most recent version of the software, Stone can no longer help every single user that has a problem, but hopes that others with expertise will chime in on mailing lists and web pages. Additionally, he sees the expertise of the users as a conduit that will enable to program to grow into new domains. Right now a user can contribute a plugin to VMD, but Stone is already thinking about how others could change features beyond just the plugin menu. “What if you wanted to make your own way of viewing your molecule,” Stone reiterates. “There are some creative people out there, and they might want to add their own new way of viewing a molecule.” With such user input, VMD can only broaden its capabilities.
While the future holds larger systems, more novel technologies, and greater user input, VMD seems destined to remain on the cutting edge with the team of John Stone and Klaus Schulten. Both men are willing to take risks to bring the best tools to the scientific community as quickly as possible. When asked what significant scientific discoveries have been made with VMD, Schulten at first seems puzzled. “I could ask you the same question,” replies Schulten. “What was the most beautiful thing you discovered with your eyes?” By this account the science made possible with VMD seems limitless. And indeed, with a general access program that furnishes scientists with better and better eyes, the imagination can flourish.
Other Related Articles
If you enjoyed this article, you might be interested in these other histories:History of Magnetoreception
History of Polyenes
History of Membrane Proteins
History of Bionanotechnology
History of Photosynthesis
History of NAMD
History of MDFF (Molecular Dynamics Flexible Fitting)
Comments?
For comments or inquiries, Lisa Pollack can be reached at the following: lpollack AT ks.uiuc.eduCitation
To cite this article, please use the following:Pollack, Lisa. "VMD: Twenty Years of History and Innovation." www.ks.uiuc.edu. 16 November 2012, from http://www.ks.uiuc.edu/History/VMD/
References
William Humphrey, Andrew Dalke, and Klaus Schulten. VMD - Visual Molecular Dynamics. Journal of Molecular Graphics, 14:33-38, 1996.John E. Stone, Justin Gullingsrud, Paul Grayson, and Klaus Schulten. A system for interactive molecular dynamics simulation. In John F. Hughes and Carlo H. Séquin, editors, 2001 ACM Symposium on Interactive 3D Graphics, pp. 191-194, ACM SIGGRAPH, New York, 2001.
Brooks, Jr., F.P., M. Ouh-Young, J.J. Batter, P. J. Kilpatrick. Project GROPE–Haptic Displays for Scientific Visualization, Proceedings of SIGGRAPH '90, (Dallas, Texas, August 6-10, 1990). In Computer Graphics, 24, 4 (August 1990) ACM SIGGRAPH, pp. 177-185, New York, 1990.
Michael Krone, John E. Stone, Thomas Ertl, and Klaus Schulten. Fast visualization of Gaussian density surfaces for molecular dynamics and particle system trajectories. In EuroVis - Short Papers, 2012, pp. 67-71, 2012.
Tim Friend. The Third Domain: The Untold Story of Archaea and the Future of Biotechnology. Joseph Henry Press, Washington D. C., 2007.
P. O'Donoghue, A. Sethi, C. R. Woese, and Z. Luthey-Schulten. The evolutionary history of Cys-tRNA(Cys) formation. PNAS, 102(52):19003-19008, 2005.
E. Roberts, J. Eargle, D. Wright, and Z. Luthey-Schulten. MultiSeq: Unifying sequence and structure data for evolutionary analysis. BMC Bioinformatics, 7:382, 2006.
John E. Stone, David J. Hardy, Barry Isralewitz, and Klaus Schulten. GPU algorithms for molecular modeling. In Jack Dongarra, David A. Bader, and Jakub Kurzak, editors, Scientific Computing with Multicore and Accelerators, chapter 16, pp. 351-371. Chapman & Hall/CRC Press, 2011.David J. Hardy, John E. Stone, Kirby L. Vandivort, David Gohara, Christopher Rodrigues, and Klaus Schulten. Fast molecular electrostatics algorithms on GPUs. In Wen-mei Hwu, editor, GPU Computing Gems, chapter 4, pp. 43-58. Morgan Kaufmann Publishers, 2011.
John E. Stone, David J. Hardy, Jan Saam, Kirby L. Vandivort, and Klaus Schulten. GPU-accelerated computation and interactive display of molecular orbitals. In Wen-mei Hwu, editor, GPU Computing Gems, chapter 1, pp. 5-18. Morgan Kaufmann Publishers, 2011.
John E. Stone, Kirby L. Vandivort, and Klaus Schulten. Immersive out-of-core visualization of large-size and long-timescale molecular dynamics trajectories. Lecture Notes in Computer Science, 6939:1-12, 2011.
Jeremy Enos, Craig Steffen, Joshi Fullop, Michael Showerman, Guochun Shi, Kenneth Esler, Volodymyr Kindratenko, John E. Stone, and James C. Phillips. Quantifying the impact of GPUs on performance and energy efficiency in HPC clusters. In International Conference on Green Computing, pp. 317-324, 2010.


