NAMD Plot Plugin, Version 1.0
|
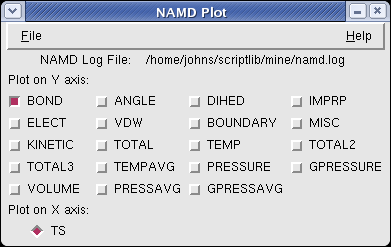
The NAMD Plot plugin provides an easy-to-use interface for plotting energy, volume, and other statistics reported in NAMD log files during a simulation. The functionality is similar to that provided by the 'namdplot' shell script included with NAMD, but uses other VMD plugins to do the plotting so no extra software is required. Using NAMD Plot (Graphical) Open the plugin in the extensions menu, then select the NAMD log file you would like to plot. Select the data fields you want to plot on the Y axies. Once everything is selected, use the "Plot Selected Data" choice in the File menu to create a graph of the fields you've selected. If you select data fields that don't exist in the NAMD log file you're plotting, and error will be returned. Using NAMD Plot (text commands) The NAMD Plot plugin can also be accessed with text commands. In order to use the NAMD Plot package from the command line or from within scripts, you must first run 'package require namdplot'. From there, you can use the 'namdplot' text command to perform various types of plots, including some that aren't accessible in the graphical interface. Text command examples
|
 NAMD Plot Field Selection Window
|
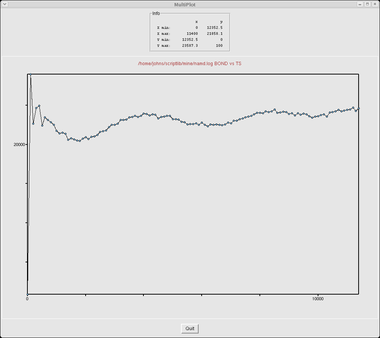
 "BOND vs TS" results displayed using MultiPlot plugin
|
|


