IR Spectral Density Calculator Plugin, Version 1.3
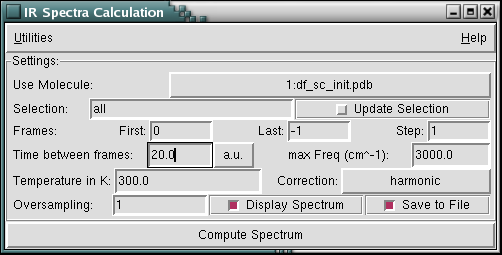
This plugin provides a graphical interface to compute spectral densities from trajectories using time series data created with the measure dipole command in VMD and a custom spectral densities plugin to compute the auto-correlated Fourier transform. Please note that this is using the total dipole moment of all atoms in the selection and not averaging over individual molecules. The latter and other types of auto-correlations can be computed through the script interface of the specden command which is part of the SignalProc plugin collection and described in the respective documentation. The spectral density plugin also supports a selection of thermal corrections to the peak intensities. It is recommended to stick to the default setting (harmonic) unless you know what you are doing. You have to have a trajectory already loaded and have the option to view the resulting spectrum in a MultiPlot window and write it to a file.
Remarks

In order to get meaningful results, the selection of atoms has to have (partial) charges assigned, so loading a corresponding topology file (.psf, .parm7), that contains this information is highly recommended. For cases, where this is not available, you have the options to either guess charges using the CHARMM guess routine from the APBSrun plugin or to load an atom name to charge mapping from an external file. Instead of using the simple guess, you may want to consider using the AutoPSF plugin to create a matching .psf file for your system.
This plugin can also be used to compute spectral densities from ab initio MD simulations, if one has computed maximally localized Wannier functions along the trajectory. A corresponding manually loadable charge mapping would look like be following (element X stands for the Wannier centers):
     # pseudopotential valence charges from cpmd run.
     Zn  12.0
     O    6.0
     N    5.0
     C    4.0
     H    1.0
     X   -2.0 # electron pairs from localization


