NAMD Performance
NAMD 3.0alpha GPU benchmarking results
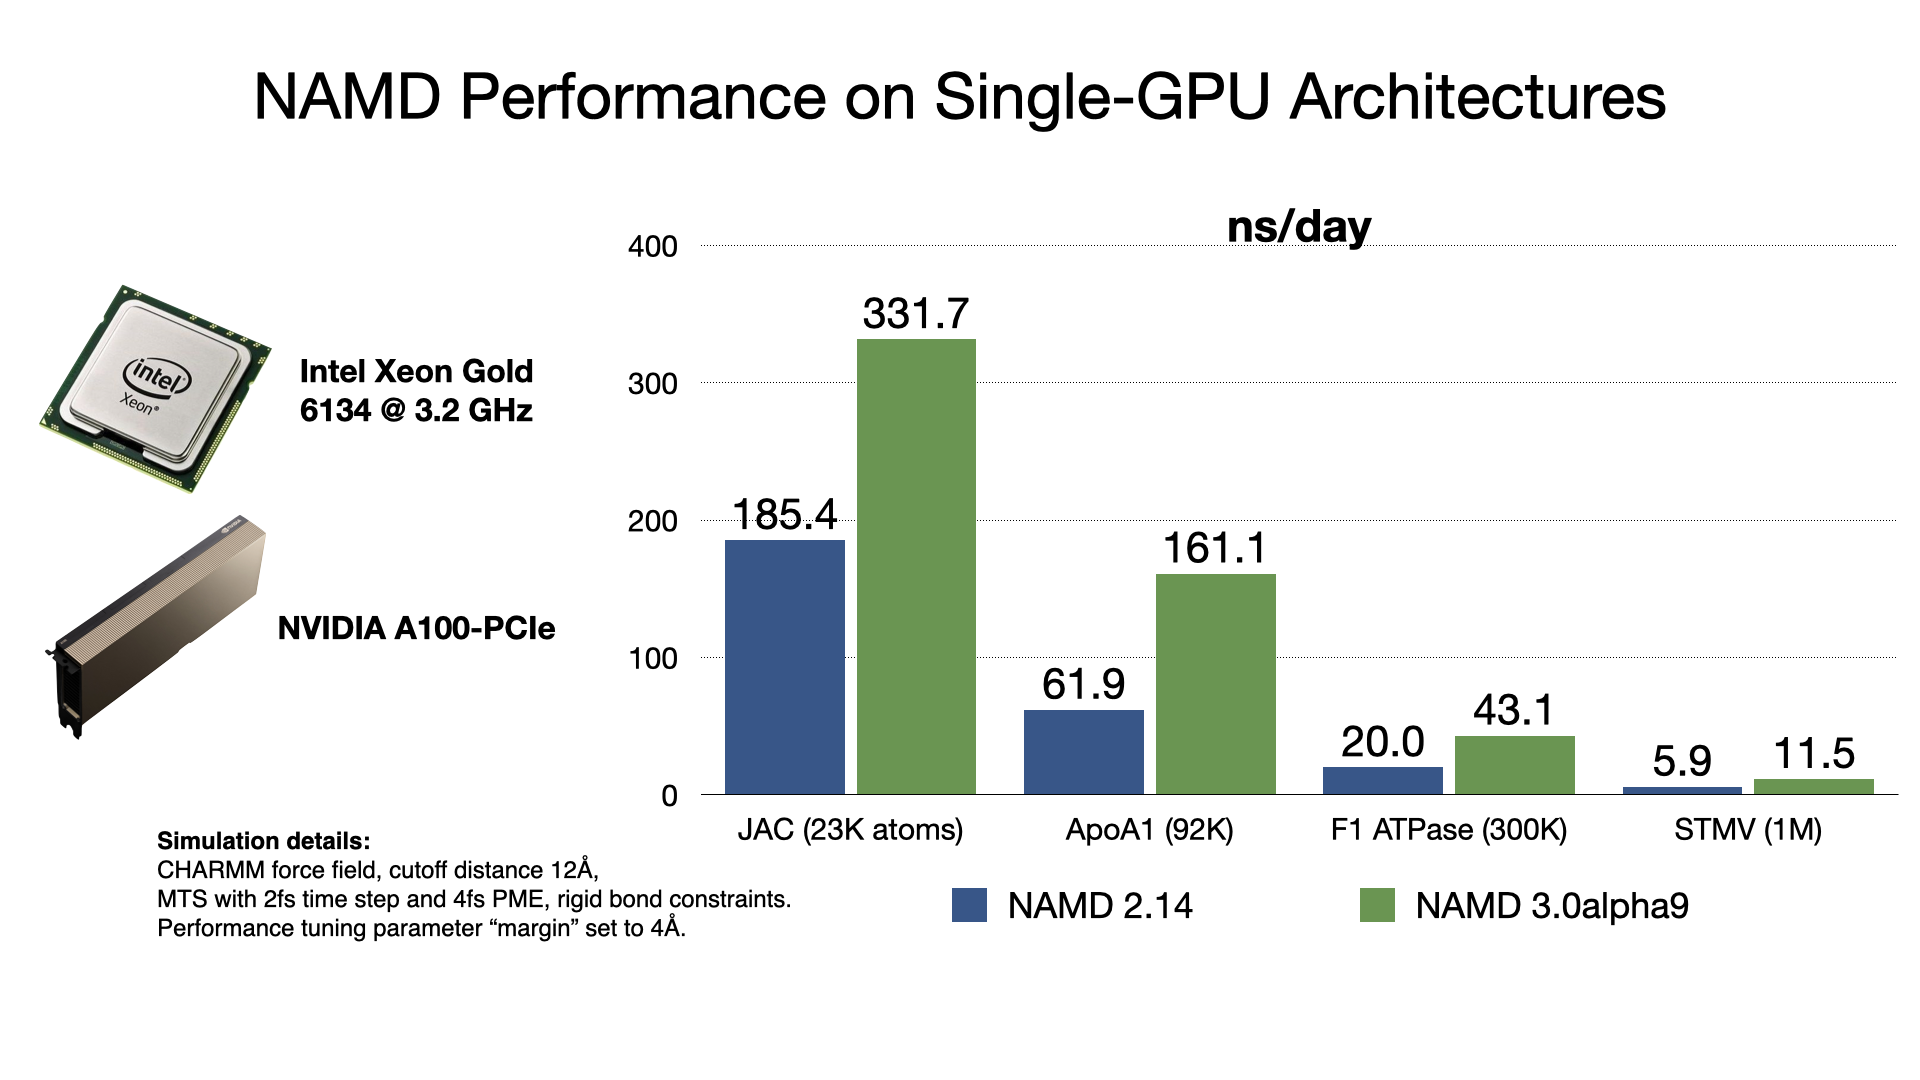
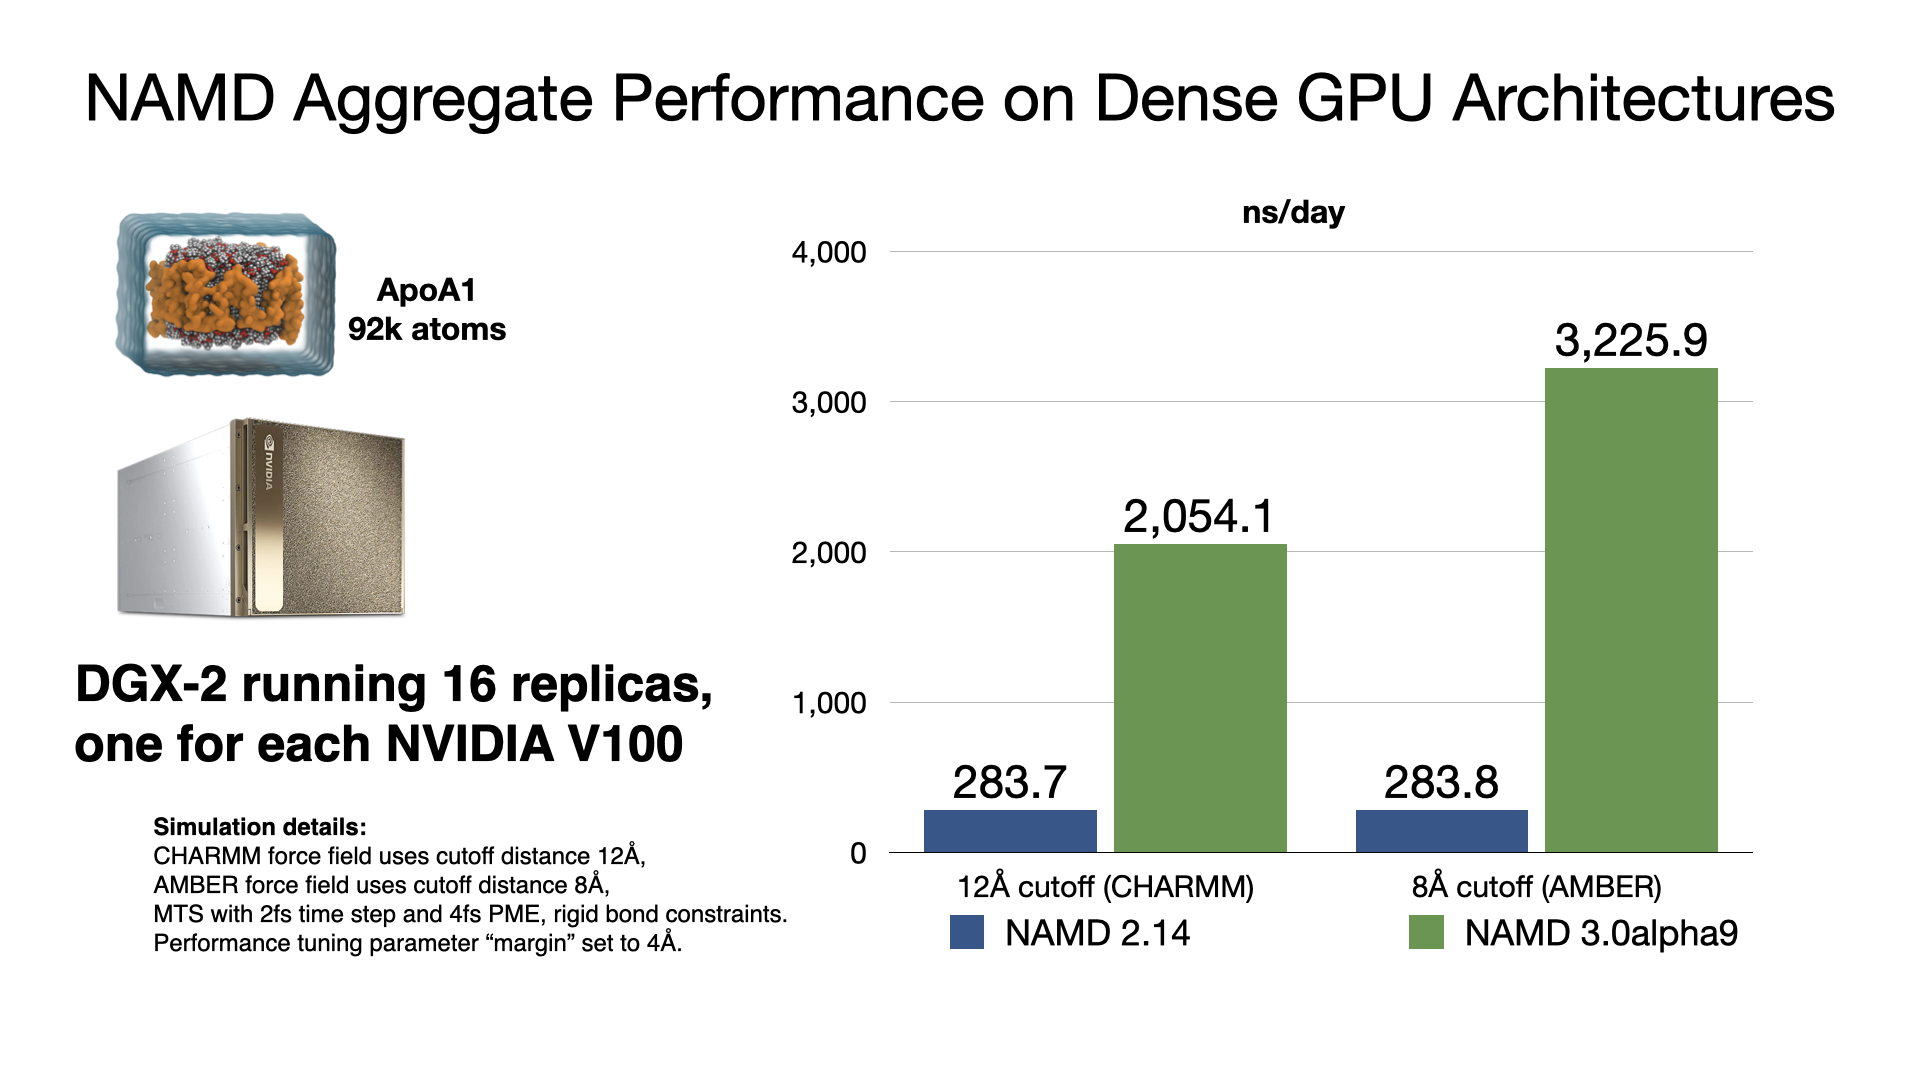
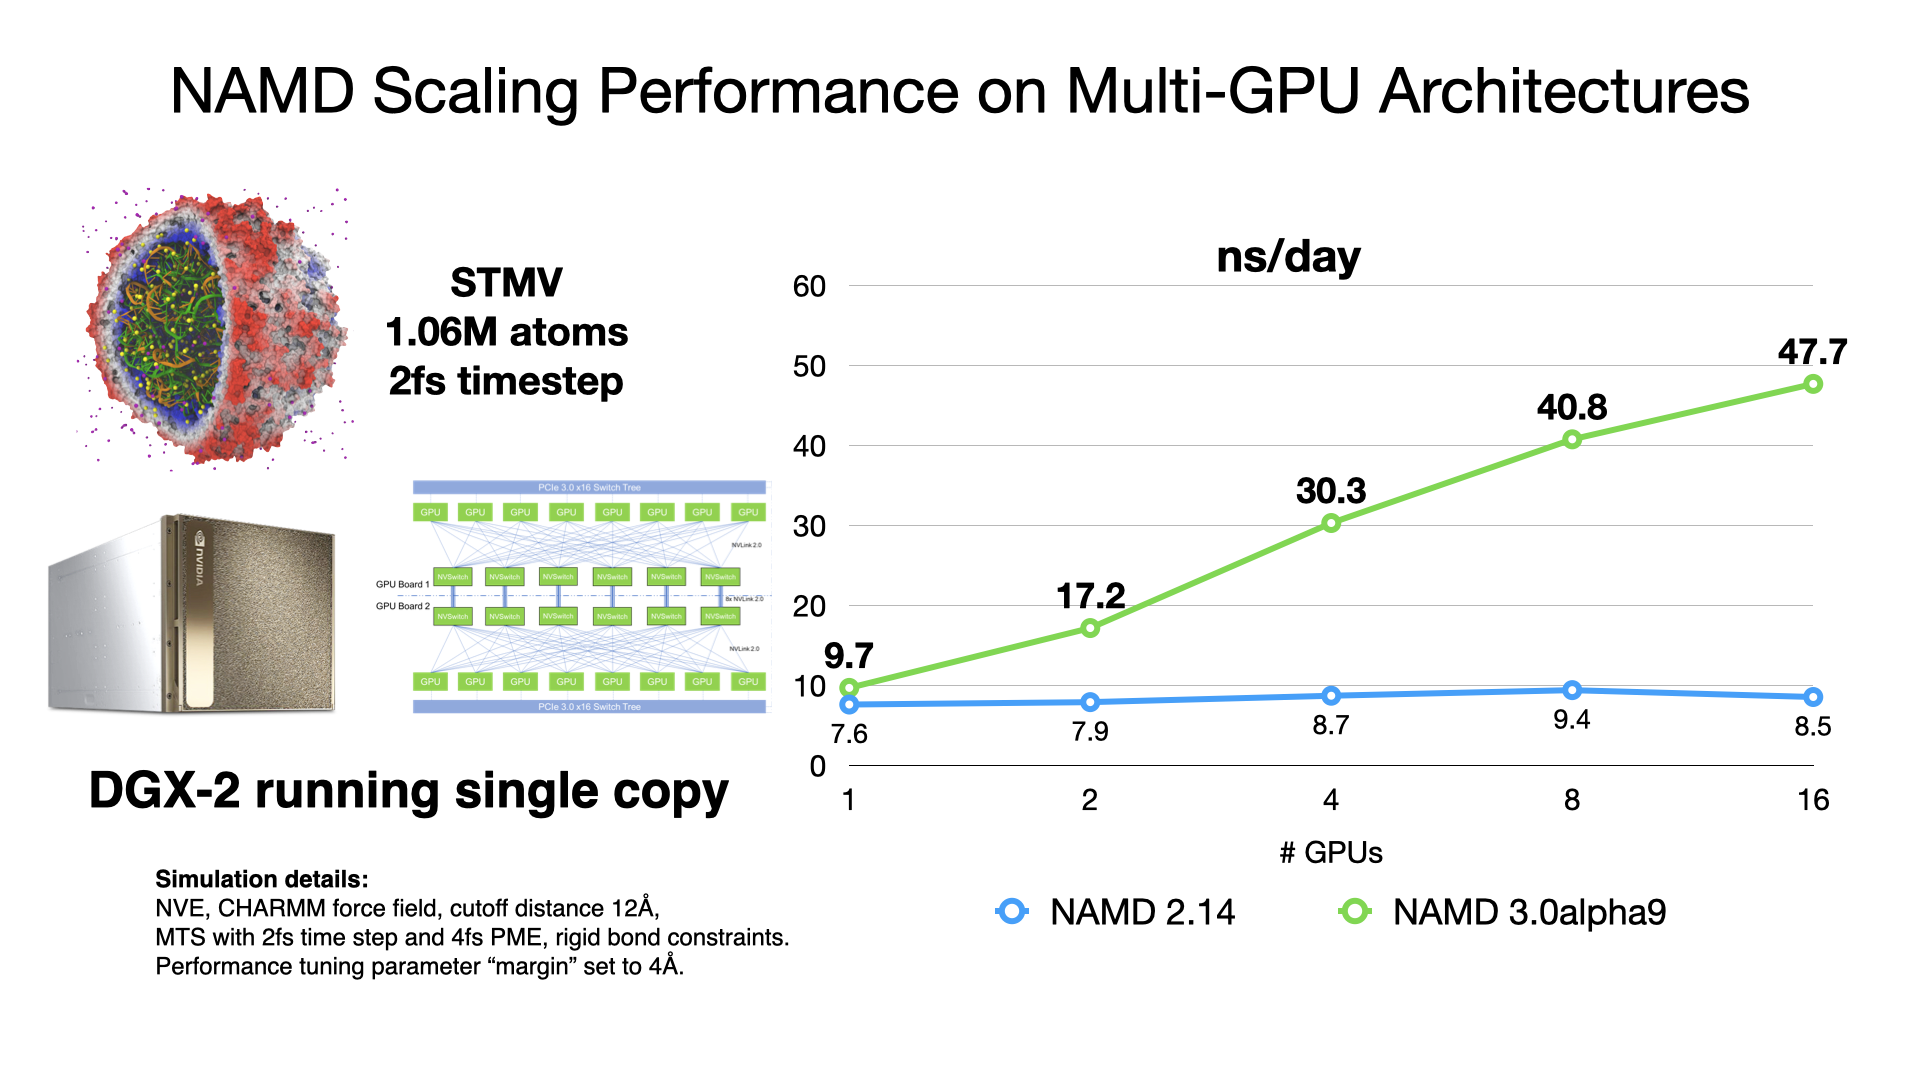
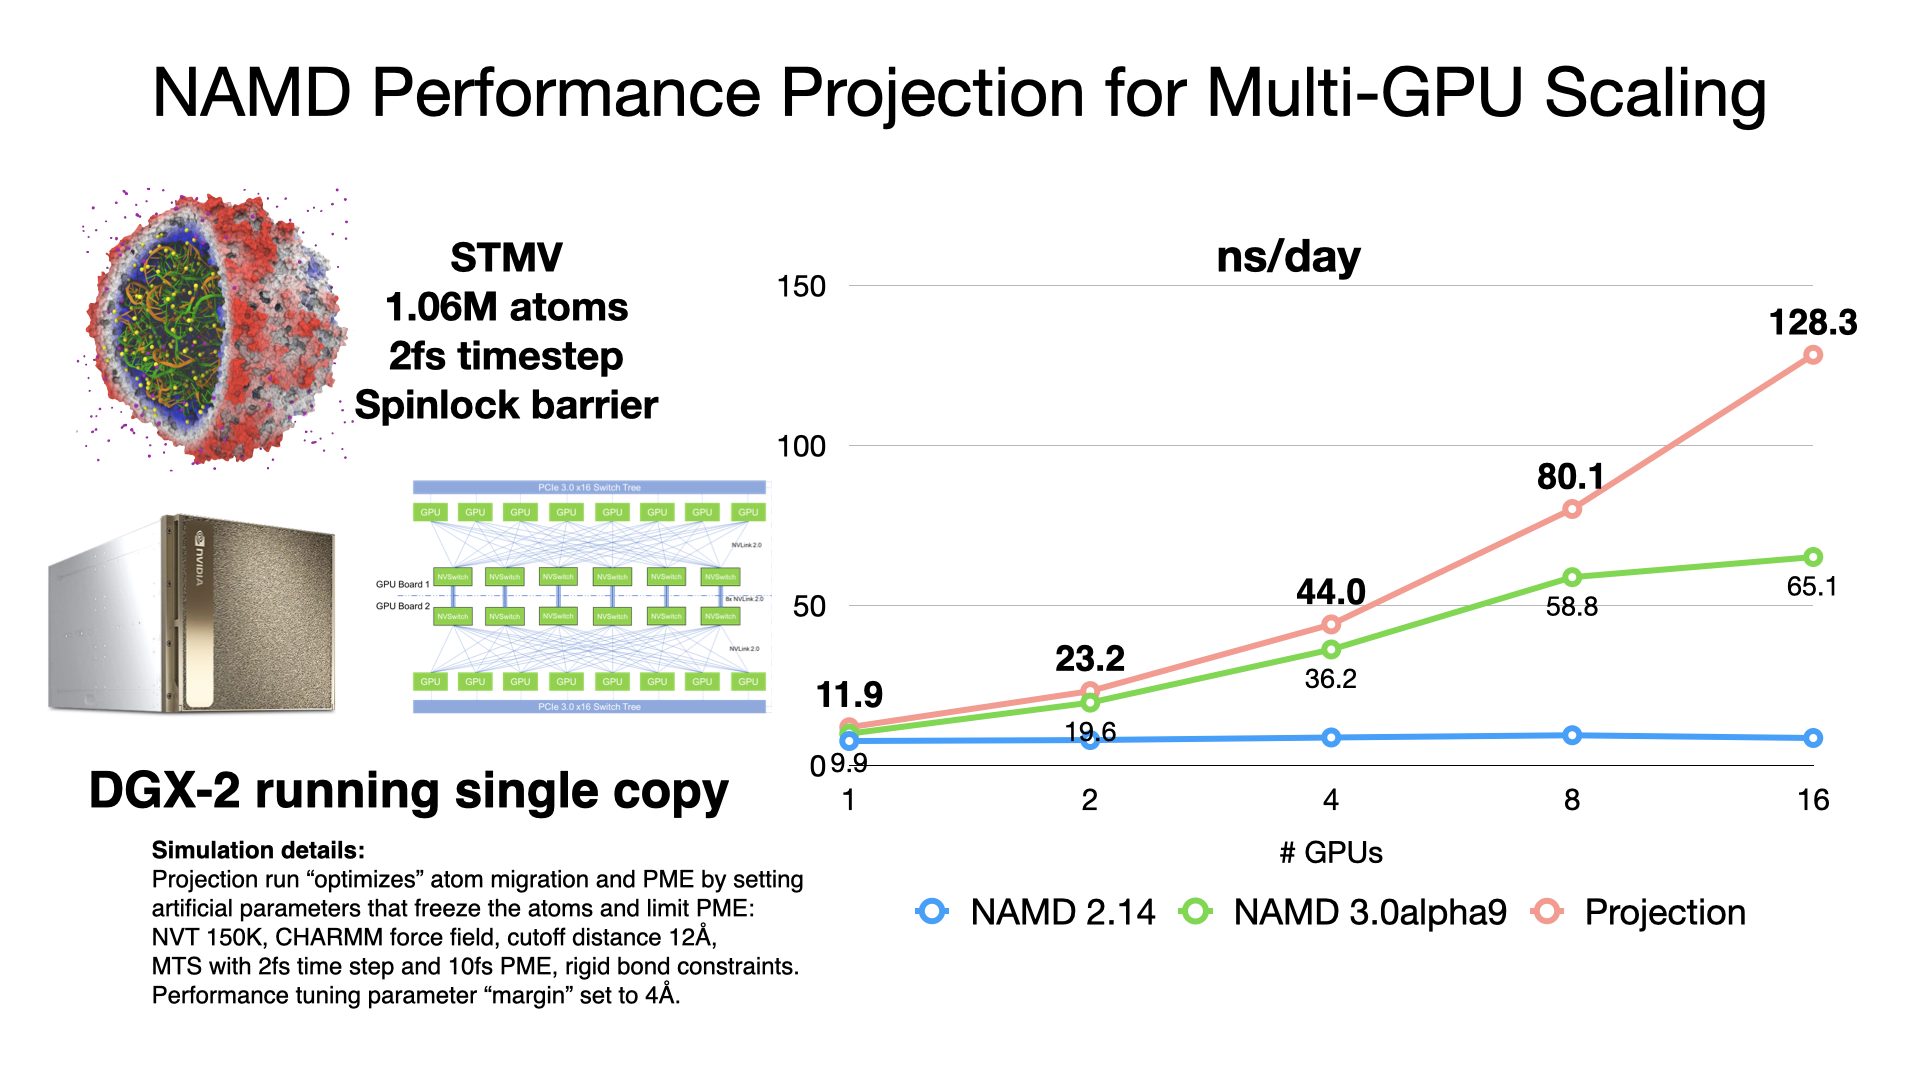
NAMD 3.0alpha, in addition to the force calculations, now offloads numerical integration and rigid bond constraints to the GPU. Doing so produces a substantial speedup factor of 2-3x over previous GPU performance in NAMD 2.14 by offloading almost all calculation to the GPU and by reducing host-device communication latencies by maintaining the simulation data on the GPU. With very little work remaining on the CPU cores, NAMD 3.0alpha no longer needs a large number of CPU cores to "keep up" with each GPU, which is reflected in the much greater aggregate throughput performance now possible on GPU-dense architectures. More information and software downloads are available on the NAMD 3.0alpha web page.
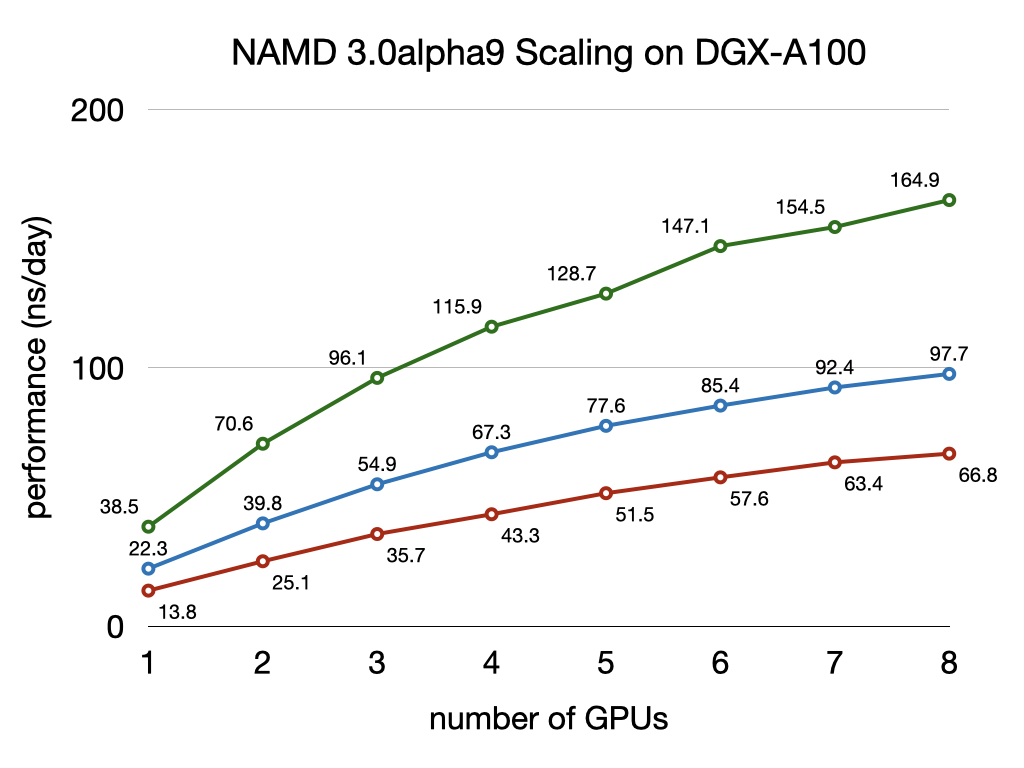
Benchmarking STMV (1.06M atoms) simulated at NVT with PME and margin 8, with different parameter sets, listed from highest to lowest:
- Green line: 8 A cutoff; hydrogen-mass repartitioning; 4 fs time step
- Blue line: 8 A cutoff; multiple time stepping with 2, 4 fs time steps
- Red line: 12 A cutoff; multiple time stepping with 2, 4 fs time steps
NAMD 2.15alpha parallel scaling results
NAMD 2.15alpha on STMV matrix systems (2fs timestep, 12A cutoff + PME every 3 steps) on TACC Frontera
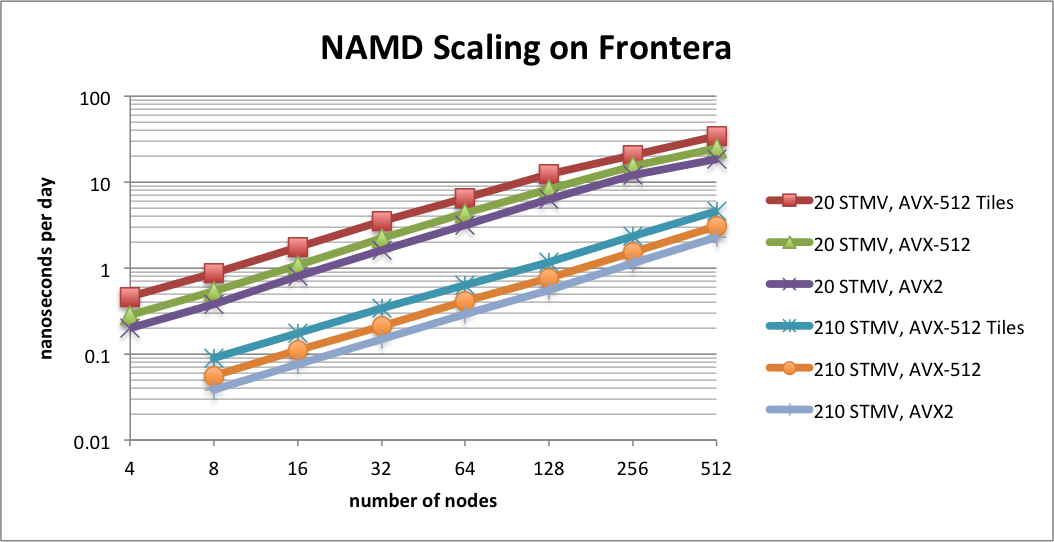
NAMD 2.15alpha1 scaling on TACC Frontera simulating synthetic benchmark systems comprised of tiling STMV in arrays of 5x2x2 (21M atoms) and 7x6x5 (224M atoms). The simulations use Langevin piston and Langevin damping for pressure and temperature control with a 2fs timestep, 12A cutoff, and PME every 3 steps. Special support has been added for AVX-512F enabled CPUs, such as the Cascade Lake processors of Frontera. This AVX-512 tile list kernel (contributed by Michael Brown, Intel) is able to achieve up to a 1.8x speedup on Intel Xeon processors. The new AVX-512 support is already available in the NAMD nightly build (through build configuration Linux-AVX512-icc) and is compared here to the Sky Lake optimizations (Linux-SKX-icc) and the AVX2 auto-vectorization (Linux-x86_64-icc) already available in NAMD 2.14.
NAMD 2.14 parallel scaling results
NAMD 2.14 on STMV matrix systems (NPT, 2fs timestep, 12A cutoff + PME every 3 steps)
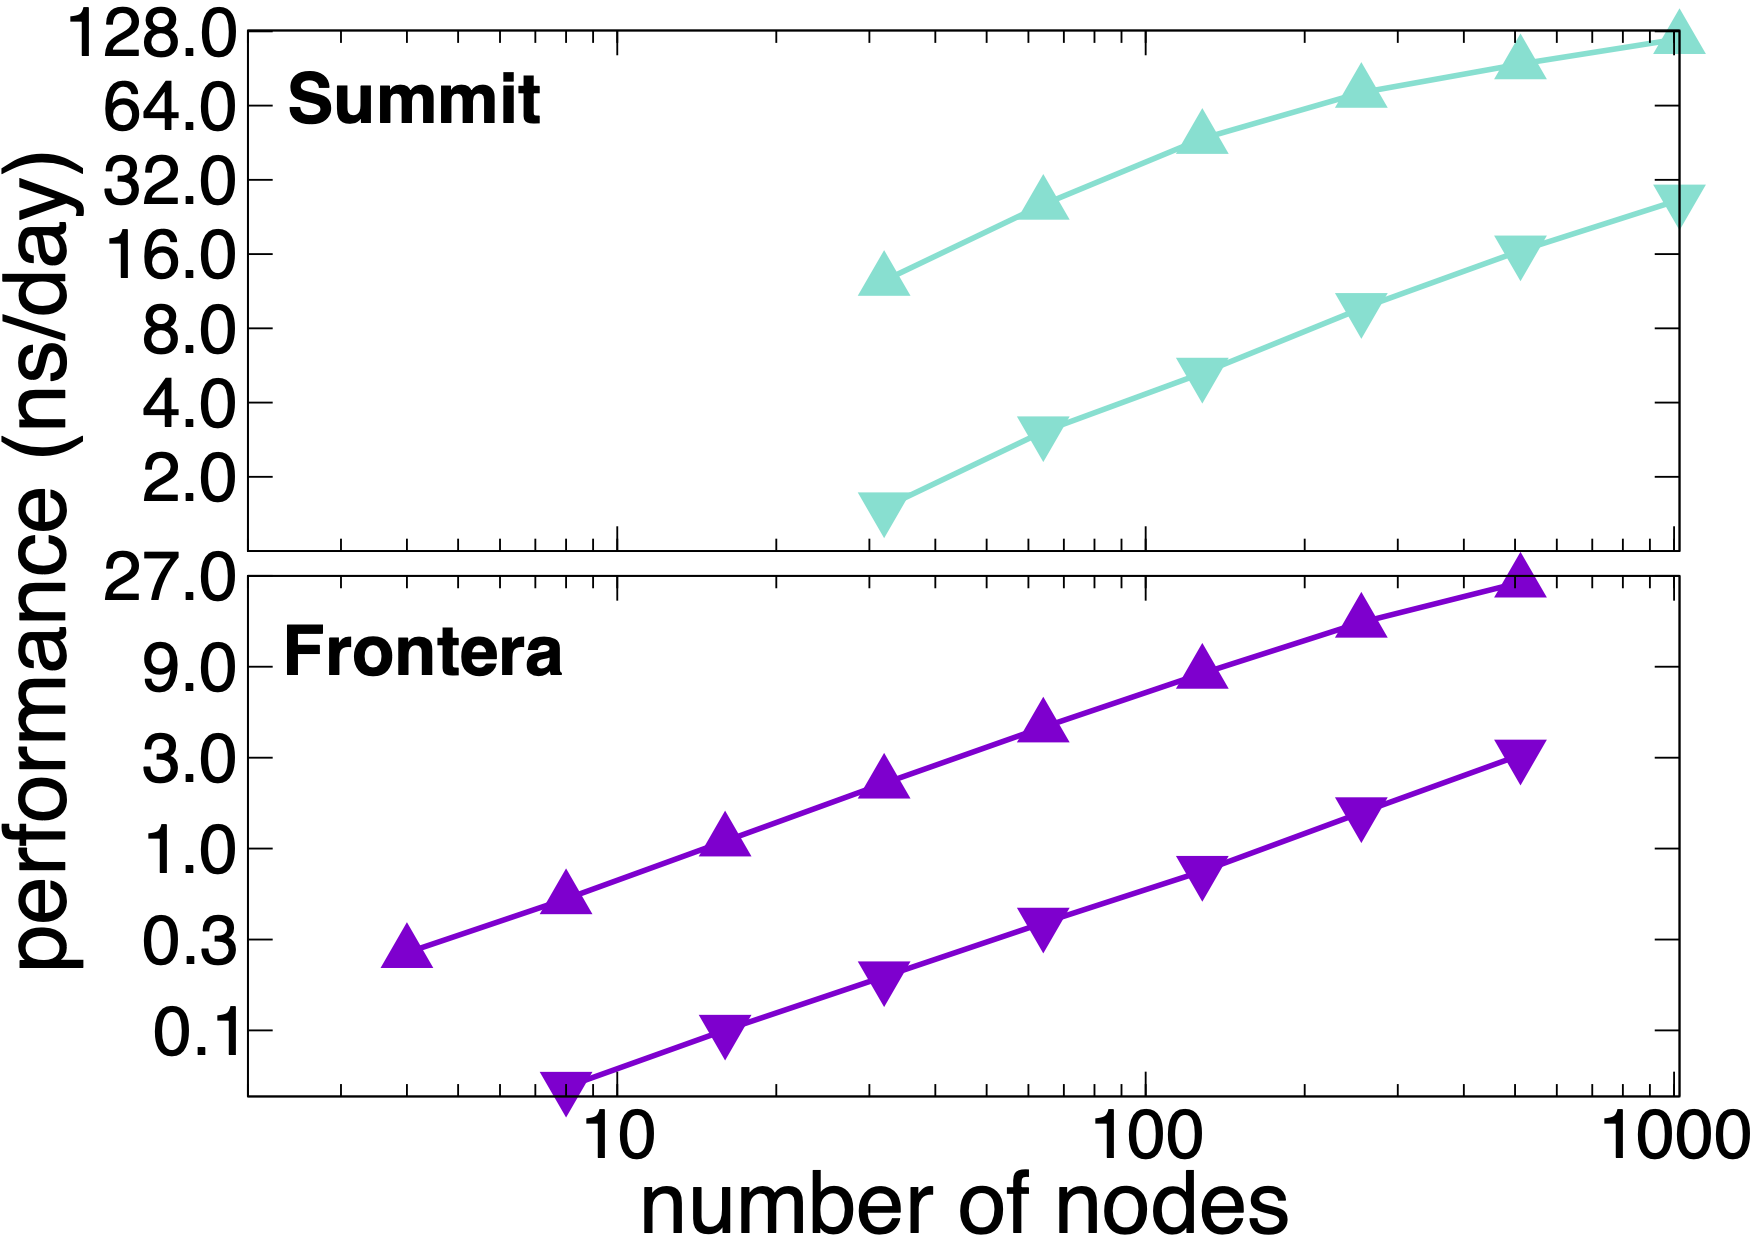
NAMD 2.14 scaling on OLCF Summit and TACC Frontera simulating synthetic benchmark systems comprised of tiling STMV in arrays of 5x2x2 (21M atoms, upward pointing triangles) and 7x6x5 (224M atoms, downward pointing triangles). The simulations use Langevin piston and Langevin damping for pressure and temperature control (NPT) with a 2fs timestep, 12A cutoff, and PME every 3 steps.
NAMD 2.14 on STMV matrix systems (NPT, 2fs timestep, 12A cutoff + PME every 3 steps) on TACC Frontera
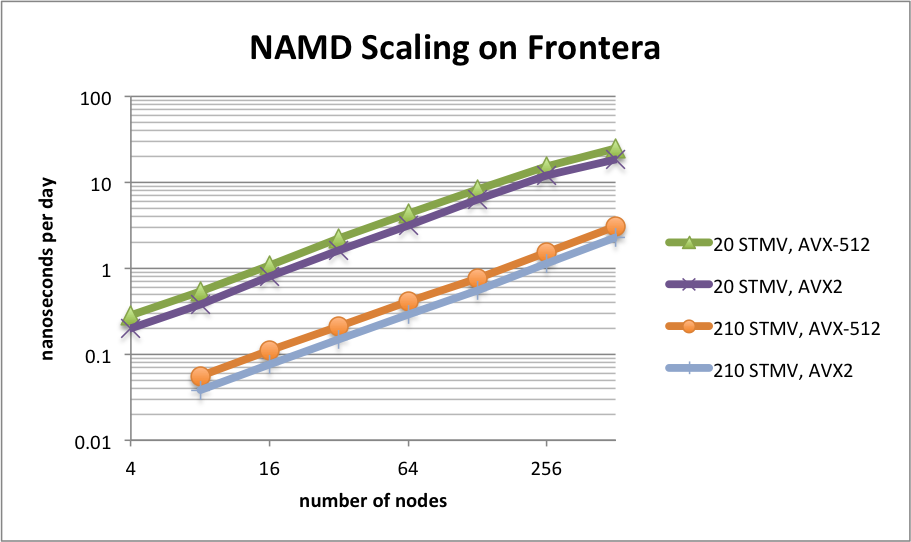
NAMD 2.14 scaling on TACC Frontera simulating synthetic benchmark systems comprised of tiling STMV in arrays of 5x2x2 (21M atoms) and 7x6x5 (224M atoms). The simulations use Langevin piston and Langevin damping for pressure and temperature control with a 2fs timestep, 12A cutoff, and PME every 3 steps.
NAMD 2.14 on STMV matrix systems (NPT, 2fs timestep, 12A cutoff + PME every 3 steps) on OLCF Summit
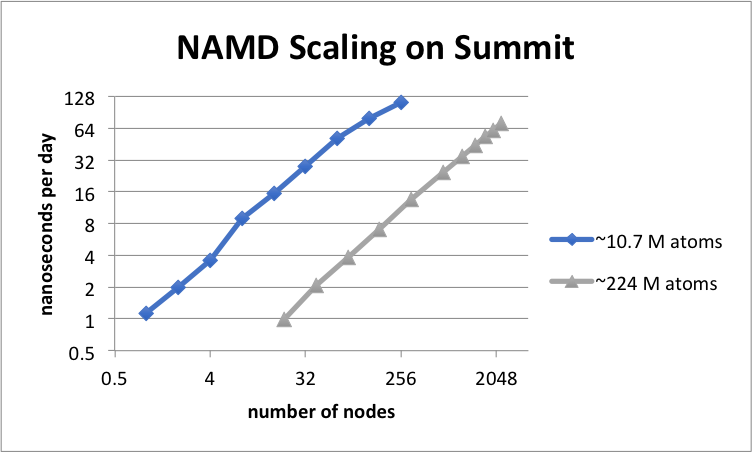
NAMD 2.14 scaling on OLCF Summit simulating synthetic benchmark systems comprised of tiling STMV in arrays of 5x2x1 (10.7M atoms) and 7x6x5 (224M atoms). The simulations use Langevin piston and Langevin damping for pressure and temperature control with a 2fs timestep, 12A cutoff, and PME every 3 steps.
NAMD 2.13 single-node GPU benchmarking results
|
|
|
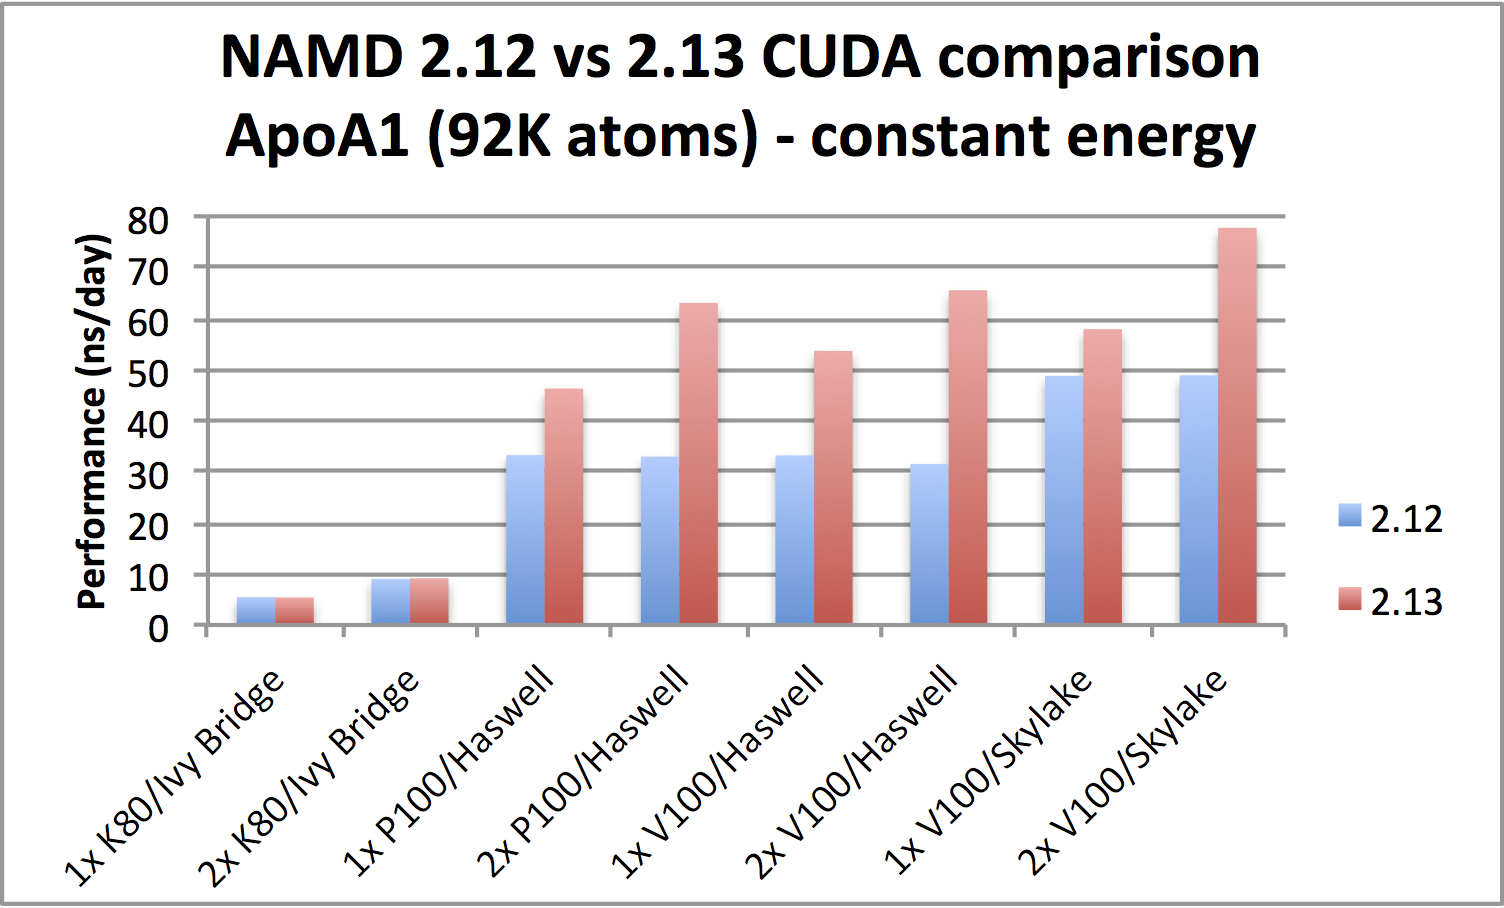
config file: apoa1_nve_cuda.namd |
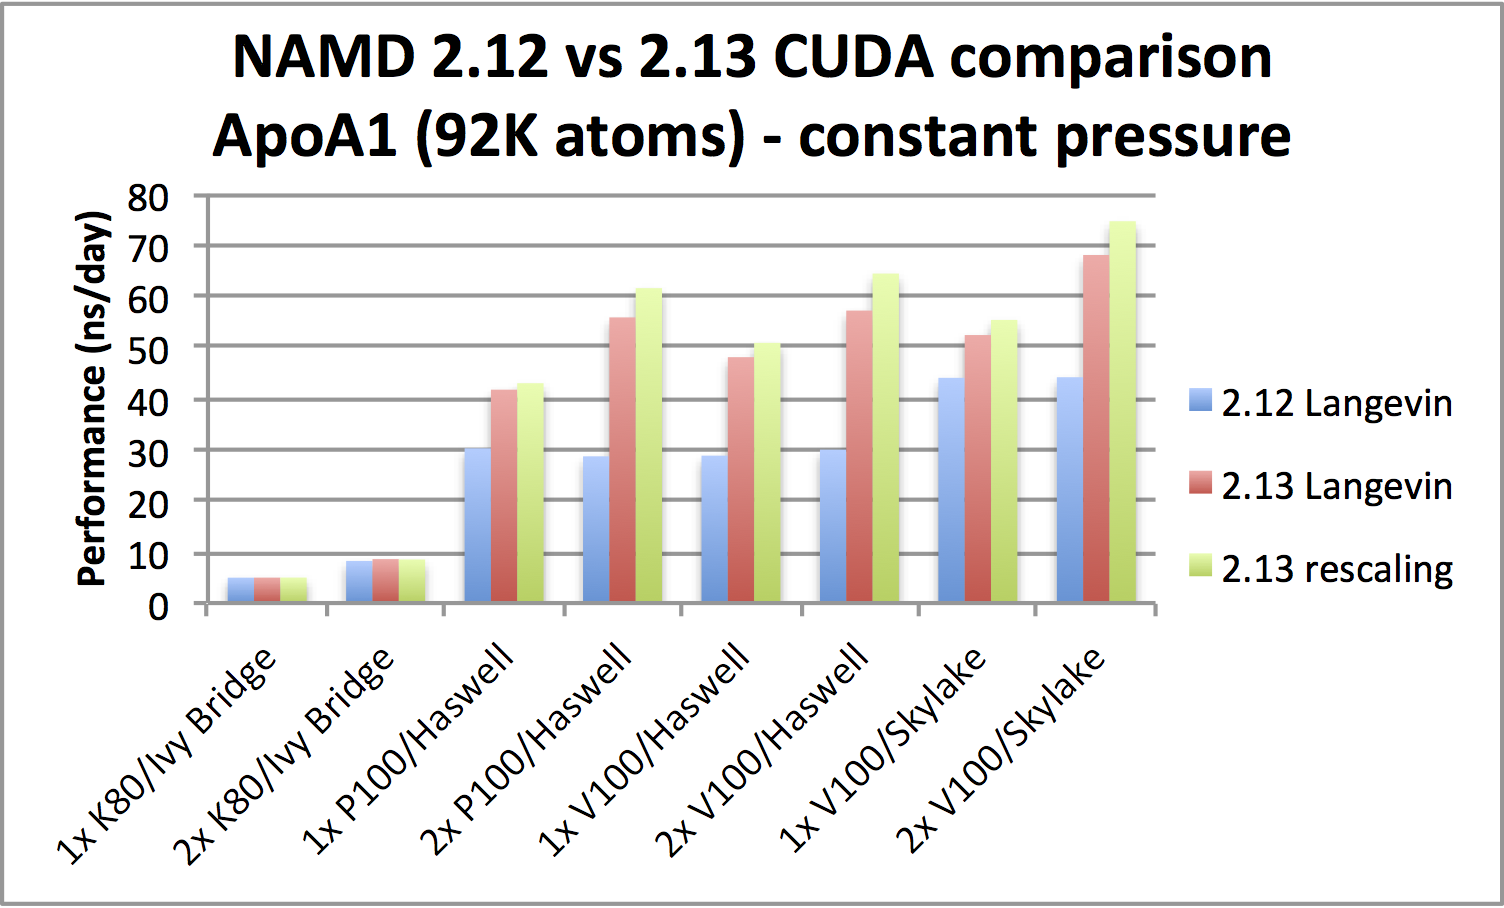
config files: apoa1_npt_cuda.namd, apoa1_nptsr_cuda.namd |
ApoA1 benchmark (92,224 atoms, periodic; 2fs timestep with rigid bonds,
12A cutoff with PME every 2 steps):
directory,
compressed tar archive (2.8 MB),
zip archive (2.7 MB).
|
|
|
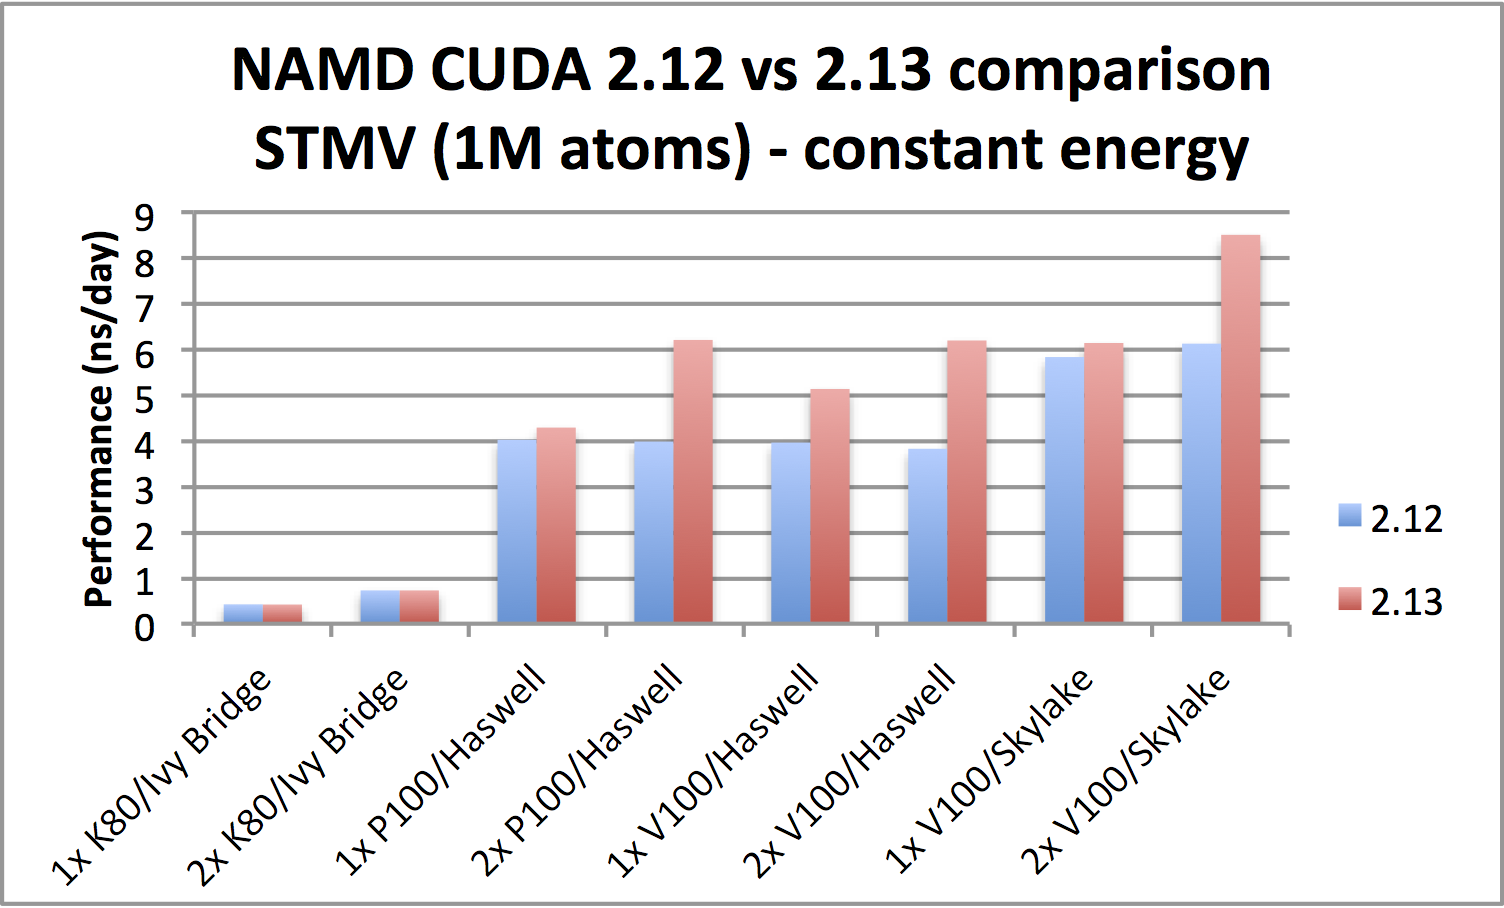
config file: stmv_nve_cuda.namd |
config files: stmv_npt_cuda.namd, stmv_nptsr_cuda.namd |
STMV benchmark (1,066,628 atoms, periodic; 2fs timestep with rigid bonds,
12A cutoff with PME every 2 steps):
directory,
compressed tar archive (28 MB),
zip archive (28 MB).
The benchmarking results shown above were obtained using nodes of the NVIDIA PSG cluster. The device selection is shown below for using two GPUs of each system, observing the CPU affinity of each PCI configuration obtained through nvidia-smi topo -m. NAMD depends heavily on good CPU utilization and is optimized for SMT 1 (i.e., no hyperthreading). Best results generally require using all available CPU cores.
- Ivy Bridge system:
dual processor Intel Xeon CPU E5-2690 v2 @ 3.00 GHz, 20 total cores.
Running with two GPUs: namd2 +p20 +setcpuaffinity +devices 0,4 apoa1_nve_cuda.namd
- Haswell system:
dual processor Intel Xeon CPU E5-2698 v3 @ 2.30 GHz, 32 total cores.
Running with two P100s: namd2 +p32 +setcpuaffinity +devices 0,1 apoa1_nve_cuda.namd
Running with two V100s: namd2 +p32 +setcpuaffinity +devices 0,2 apoa1_nve_cuda.namd
- Skylake system:
dual processor Intel Xeon Gold 6148 CPU @ 2.4 GHz, 40 total cores.
Running with two V100s: namd2 +p40 +setcpuaffinity +devices 0,2 apoa1_nve_cuda.namd
The following two scripts help automate for a given NAMD binary the benchmarking collection process, sweeping through a given range of CPU cores for each of the specified device lists.
-
namd_benchmark_cuda.sh
The syntax for use is: namd_benchmark_cuda.sh NAMDBIN CONFIG MIN-MAX[:INCR] [DEV[:DEV]*]
where NAMDBIN is the NAMD binary to benchmark and CONFIG is the configuration file, MIN is the minimum number of cores to use, MAX is the maximum number of cores to use, INCR is the core count increment, and DEV is a comma-separated device list. As an example, the following used on the Haswell V100 platform above sweeps through core counts 29-32 (i.e., +pemap 0-28, ..., +pemap 0-31) for one- and two-GPU configurations (i.e., +devices 0 and +devices 0,2):
namd_benchmark_cuda.sh namd2 apoa1_nve_cuda.namd 29-32 0:0,2
The timing results are stored into a Gnuplot-compatible data file designed to plot nanoseconds per day for each CUDA device choice for each number of cores benchmarked.
-
ns_per_day.py
This Python script is called by namd_benchmark_cuda.sh to calculate nanoseconds per day averaged over the logged TIMING statements. It needs to be located in a directory of the user's PATH to permit its calling from the previous script.
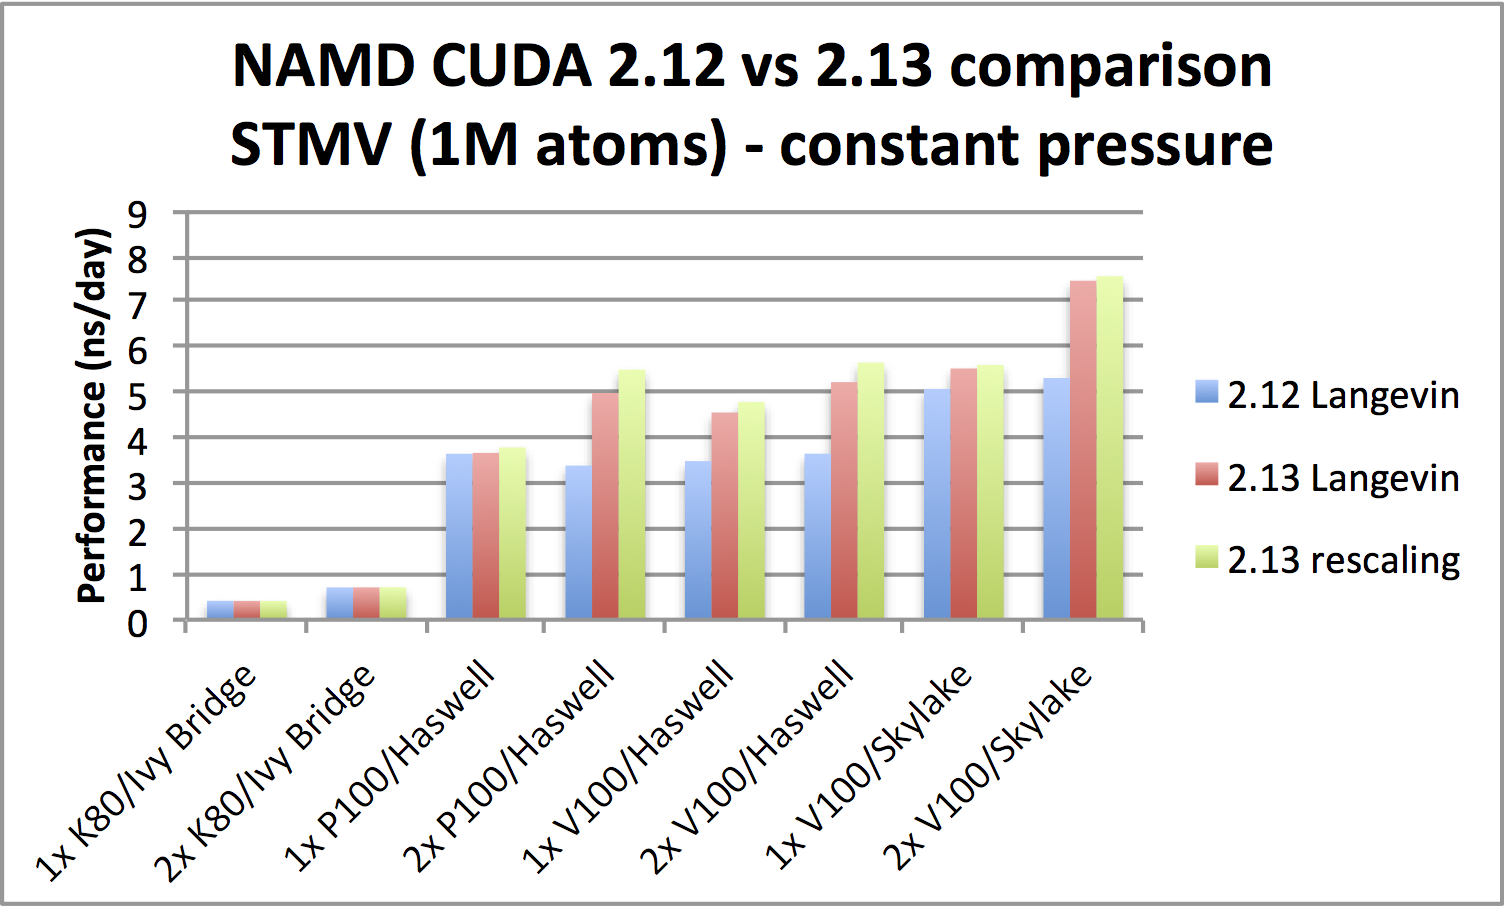
NAMD 2.13 parallel scaling results
NAMD 2.13 on STMV matrix systems (2fs timestep, 12A cutoff + PME every 3 steps) on OLCF Summit
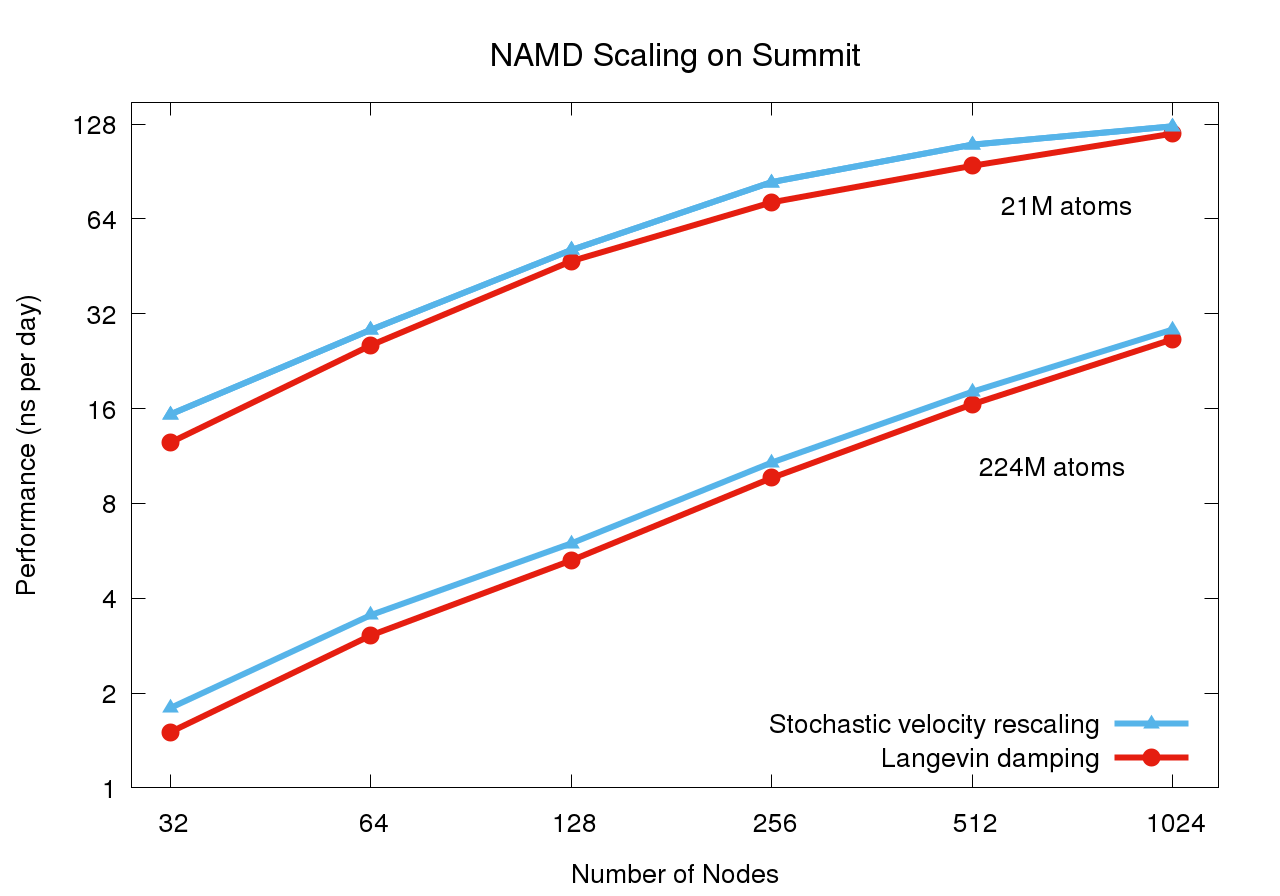
Preliminary scaling results conducted May 2018 simulating synthetic benchmark systems comprised of tiling STMV in arrays of 5x2x2 (21M atoms) and 7x6x5 (224M atoms). The use of stochastic velocity rescaling thermostat offers up to 20% performance improvement over Langevin damping thermostat by reducing work done by the CPU.
NAMD pre-2.13 on STMV matrix systems (2fs timestep, 12A cutoff + PME every 3 steps) on OLCF Summit
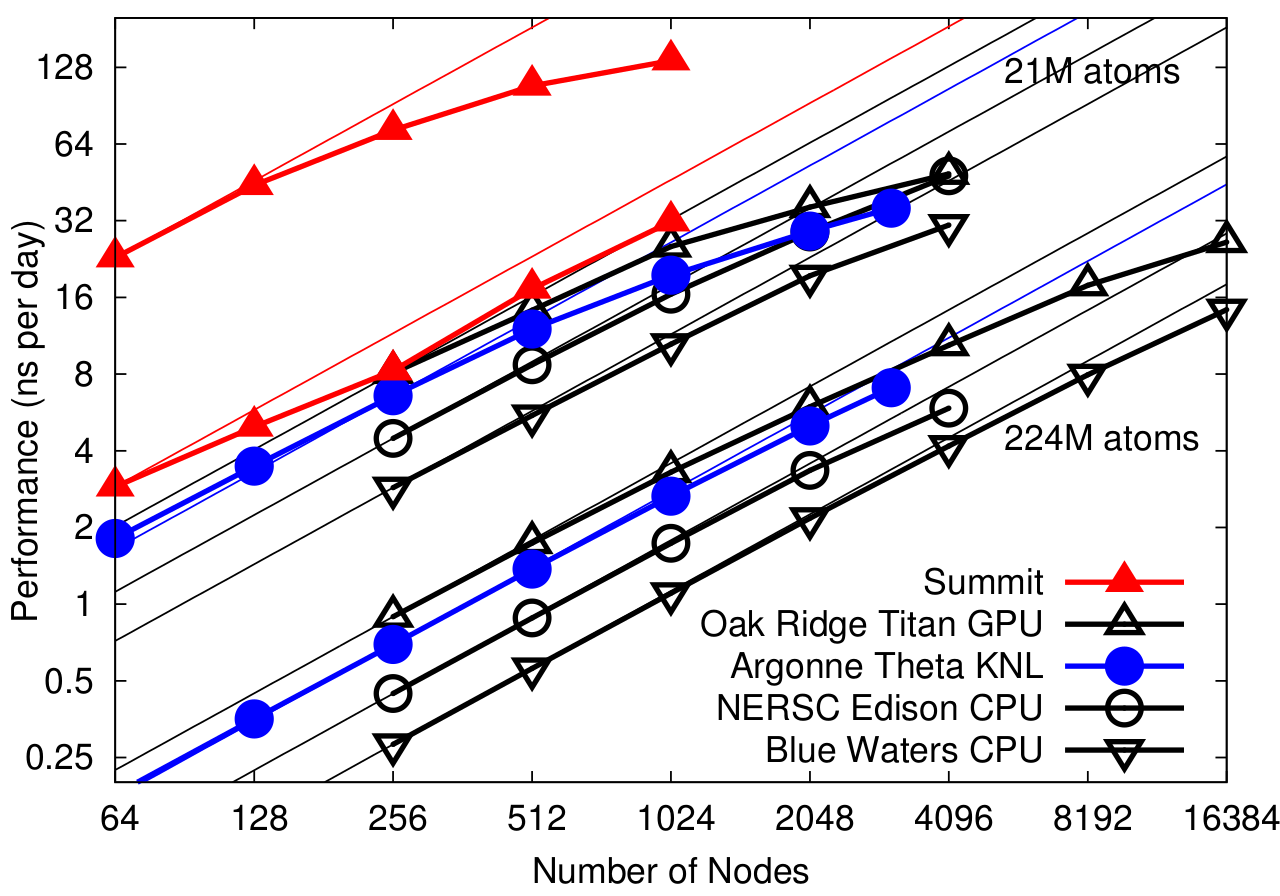
Preliminary scaling results for Summit conducted March 2018 simulating synthetic benchmark systems comprised of tiling STMV in arrays of 5x2x2 (21M atoms) and 7x6x5 (224M atoms). Comparing performance to other platforms.
NAMD 2.12 parallel scaling results
NAMD 2.12 on STMV matrix systems (2fs timestep, 12A cutoff + PME every 3 steps) on OLCF Titan
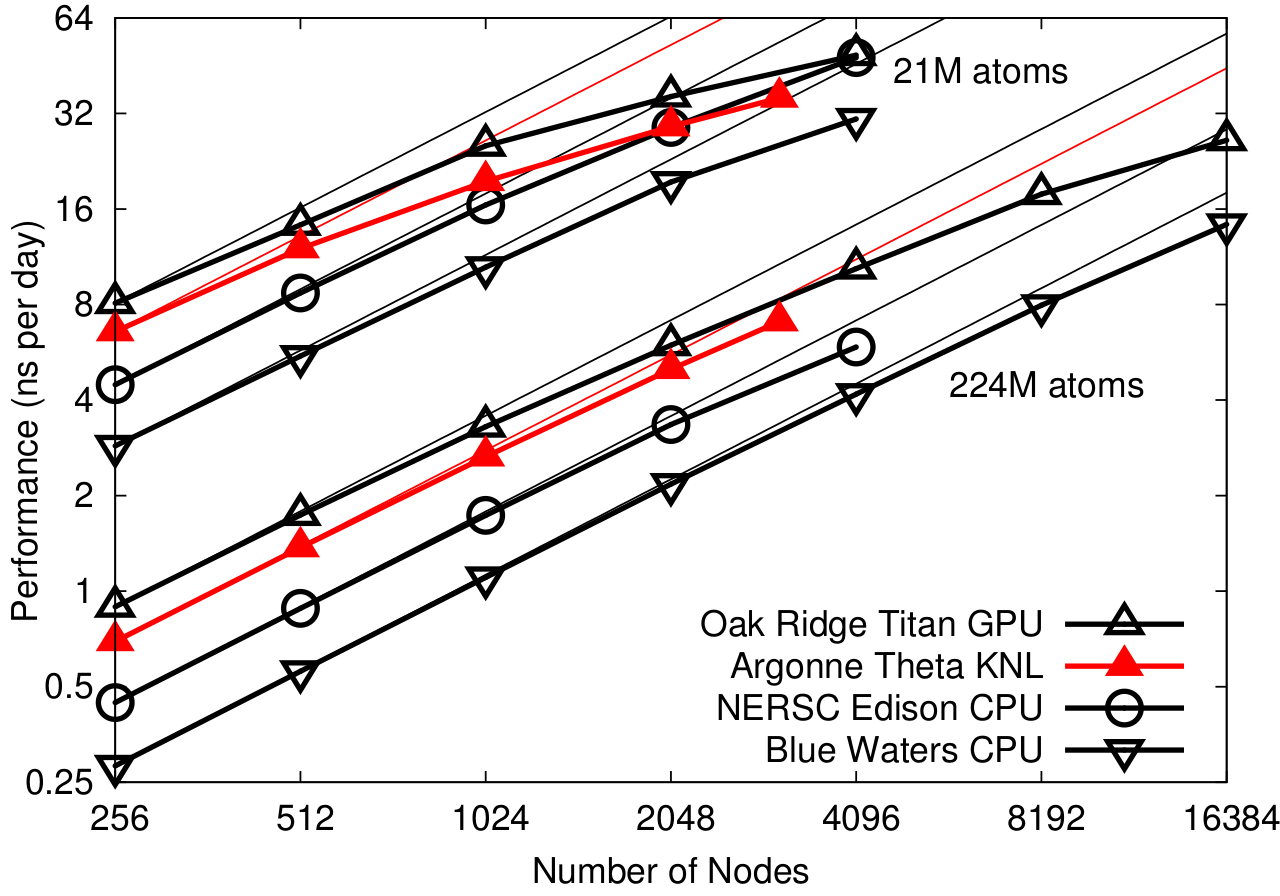
Scaling results simulating synthetic benchmark systems comprised of tiling STMV in arrays of 5x2x2 (21M atoms) and 7x6x5 (224M atoms).
NAMD 2.12 on billion-atom STMV matrix (2fs timestep, 12A cutoff + PME every 3 steps)
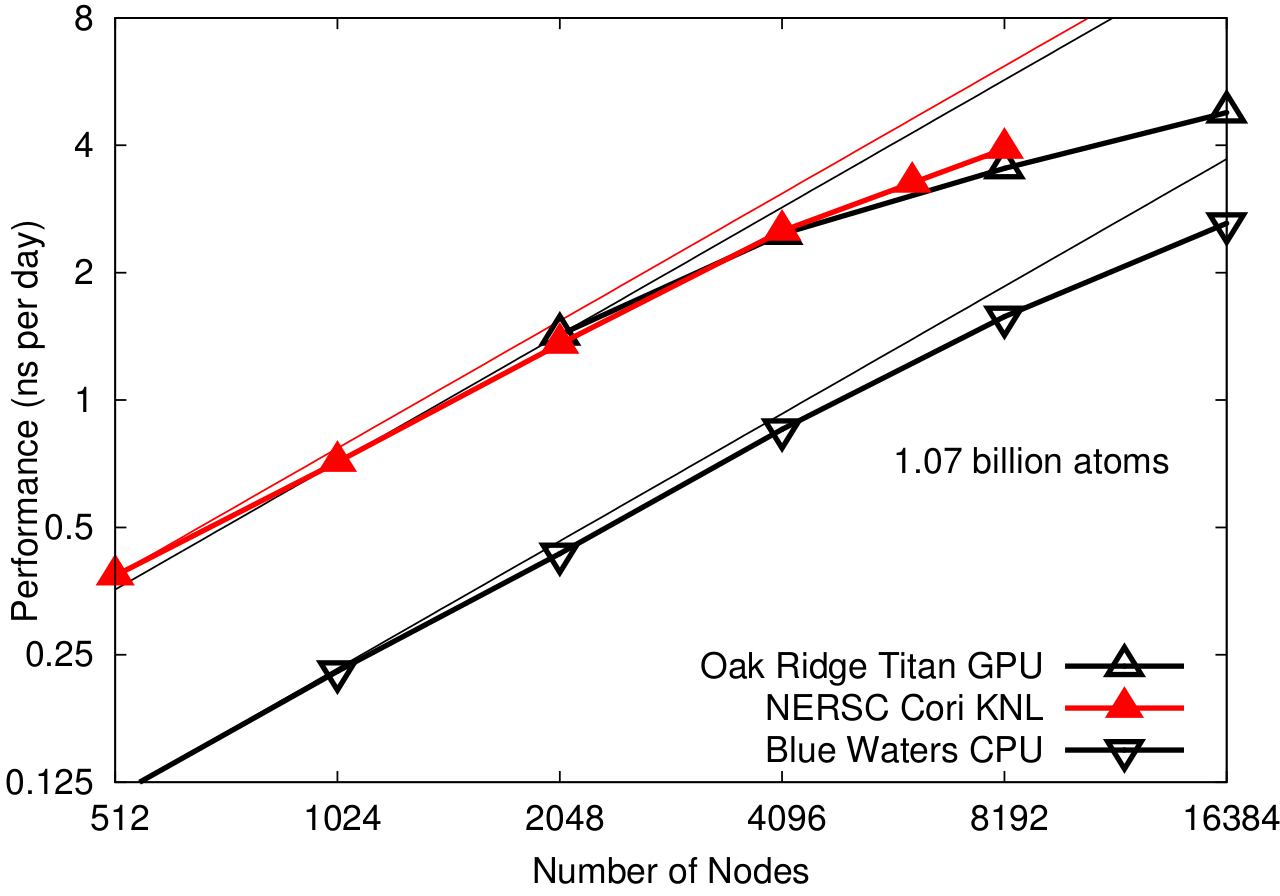
First billion-atom run demonstrated on synthetic benchmark system comprised of tiling STMV in array of 10x10x10 (1.07B atoms).
Earlier parallel scaling results
NAMD 2.11 on STMV (2fs timestep, 12A cutoff + PME every 3 steps) on TACC Stampede

NAMD 2.11 disables asynchronous offload on MIC due to memory/performance leaks in the Intel runtime.
Plot data, job, config, and output files: directory or 153K tar.gz
NAMD 2.10 on STMV (2fs timestep, 12A cutoff + PME every 3 steps) on TACC Stampede

NAMD 2.10 on 20STMV and 210STMV (2fs timestep, 12A cutoff + PME every 3 steps)
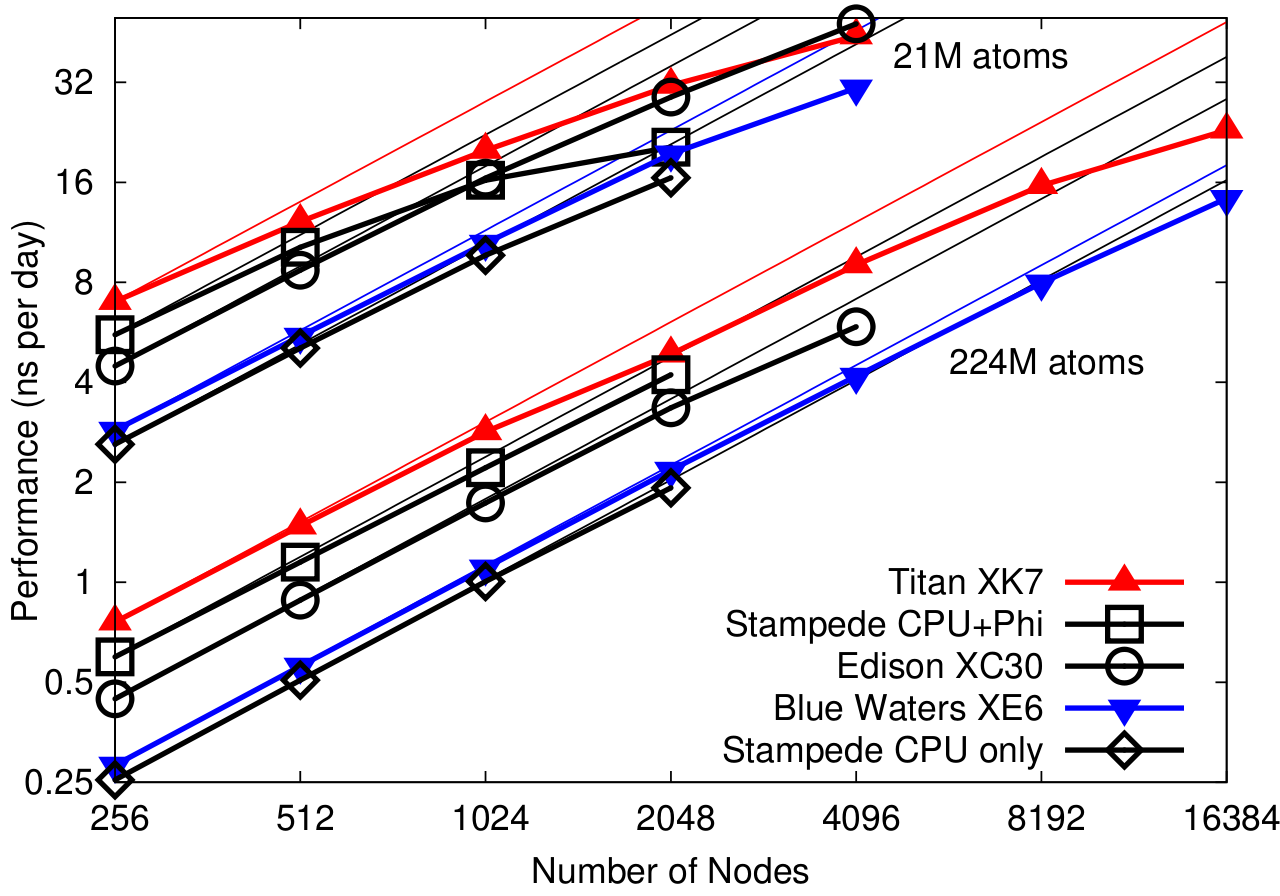
Figure from:
James C. Phillips, Yanhua Sun, Nikhil Jain, Eric J. Bohm, and Laximant V. Kale.
Mapping to Irregular Torus Topologies and Other Techniques for Petascale Biomolecular Simulation.
In Proceedings of the 2014 International Conference for High Performance Computing, Networking, Storage, and Analysis (SC14), 2014.
abstract,
conference,
journal
Download this benchmark:
directory,
2.5K .tar.gz,
Previous NAMD performance webpage


