VMD-L Mailing List
From: John Stone (johns_at_ks.uiuc.edu)
Date: Thu Nov 17 2005 - 15:06:18 CST
- Next message: rossi_at_york.cuny.edu: "Use VMD Graphics Primitives to Construct Stilized Cyclodextrins"
- Previous message: Luis Gracia: "Re: calculate rmsd in a loop:feedback [sorry if you get it twice]"
- In reply to: Michel Espinoza-Fonseca: "visualizing charge density in vmd"
- Messages sorted by: [ date ] [ thread ] [ subject ] [ author ] [ attachment ]
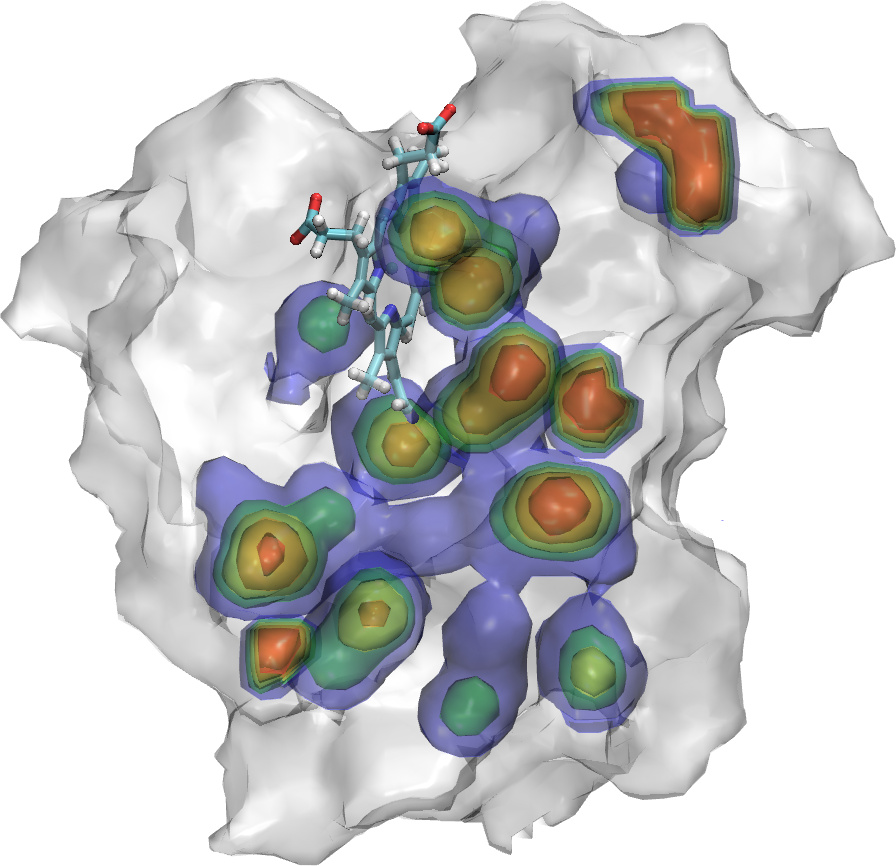
Michel,
The isovalue you select directly corresponds to the scalar potential
or density value in the volumetric dataset you're building the isosurface
from. The units and value range are entirely dependent on the original file
you loaded, as VMD doesn't know anything about semantics of the data, only
the values in each voxel. The APBS manual should state what the potential
units it outputs. From there you can display the isosurface for the potential
you're interested in. If you want to see a range of potential values you
could also draw several nested transparent isosurfaces like this:
http://www.ks.uiuc.edu/Research/vmd/images/collections/adboard2005/myoglobin-cavities-GLSL.jpg
John Stone
vmd_at_ks.uiuc.edu
On Thu, Nov 17, 2005 at 09:48:14AM -0600, Michel Espinoza-Fonseca wrote:
> Hi all,
>
> I posted a similar question in the APBS list and I received excellent feedback. However, I wanted to share my same question with the broad VMD user's list. I'm trying to visualize the dx output file of APBS in order to determine which regions of my proteins are able to better agglomerate negative charges. I found that, when I get the isosurface with VMD, there is a bar where we can change the isosurface values... So, here's my question. Do any of you know what these values mean? I just want to focus on the regions that are able to conglomerate more charges, but I still don't find the way to do it.
>
> Thanks a lot!
> Cheers
> Michel
--
NIH Resource for Macromolecular Modeling and Bioinformatics
Beckman Institute for Advanced Science and Technology
University of Illinois, 405 N. Mathews Ave, Urbana, IL 61801
Email: johns_at_ks.uiuc.edu                 Phone: 217-244-3349
  WWW: http://www.ks.uiuc.edu/~johns/      Fax: 217-244-6078
- Next message: rossi_at_york.cuny.edu: "Use VMD Graphics Primitives to Construct Stilized Cyclodextrins"
- Previous message: Luis Gracia: "Re: calculate rmsd in a loop:feedback [sorry if you get it twice]"
- In reply to: Michel Espinoza-Fonseca: "visualizing charge density in vmd"
- Messages sorted by: [ date ] [ thread ] [ subject ] [ author ] [ attachment ]


