Ionic current rectification through silica nanopores
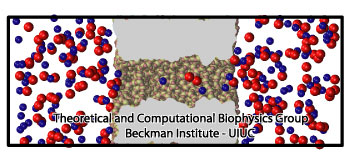 |
Figure 1. Atomic model of a silica nanopore. The figure shows a silica nanopore of 1 nm radius immersed in a KCl solution. Blue and red atoms represent K+ and Cl- ions, respectively. |
Nanopores are incredible small pores with diameters of just a few nanometers, fabricated on silica (SiO2) or other synthetic materials. Figure 1 shows an schematic model of a silica nanopore. They can be used to study the translocation of charged species, such as ions or charged molecules. Since, most nanopore applications are based on measuring the changes in the ionic current, understanding the ion dynamics through nanopores is desirable. Indeed, ionic current experiments with nanopores still surprise researchers, many fascinating results have been reported, such as ionic current rectification, nanobubbles, nanoprecipitation and surface charge inversion. Here, we present a summary of our studies about ionic current rectification in silica nanopores. More detailed information on ionic rectification is available in our recent paper. For a more general introduction about nanopores, see our website on silica nanopores.
Ionic current is affected by pore surface
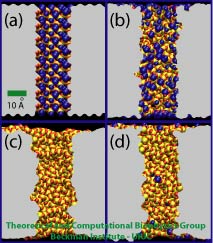
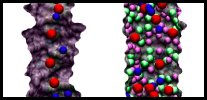
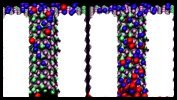
Figure 2. Four nanopore models used to study ionic current. (a) A crystalline pore, (b) a raw cut pore, and two annealed pores (c, d). Bicoordinated oxygens and four-coordinated silicons are colored in red and yellow, respectively. Dangling atoms, either dangling silicons or dangling oxygens, are colored in blue.
When immersed in electrolytic solution and under the influence of an electric field, silicon-based nanopores can produce linear ohmic responses. However, ionic current rectification is not unusual. Ionic current rectification is characterized by an increase of the ion conduction for one voltage polarity but a decrease of it for the same voltage magnitude with opposite polarity, producing an asymmetric I-V curve.
We have performed a systematic study of KCl conductance for silica nanopores using molecular dynamics (MD) simulations. Snapshots of four simulated silica nanopores are shown in Figure 2. The nanopores have 1 nm radius and were classified into three different categories according to the arrangement of surface atoms: crystalline pore, amorphous raw cut pore, and annealed amorphous pores. All nanopores have different surface topographies and were built using a silica model that reproduces the wetting properties of amorphous silica based on the concentration of non-fully coordinated silica atoms, so-called dangling atoms. The definition of a dangling atom is as follows: a silicon atom and an oxygen atom are considered covalently bonded if they have a separation distance of 0.2 nm or less; oxygens with 2 or less bonds and silicons with four bonds or less are considered dangling atoms. For more information about the silica model, click here.
Figure 3 shows the I-V curves for the nanopores presented in Figure 2. As can be observed, the overall shape of the I-V curve depends strongly on the type of pore employed. The pores that produce rectification are presented in Figure 3i, crystalline and amorphous raw cut pores show asymmetric I-V curves, with a clear hindrance in the ion conduction under positive and negative voltages, respectively. Both pores have in common a high concentration of dangling atoms at the surface (see Figure 2). For annealed pores (Figure 3ii), both with a negligible number of dangling atoms, the I-V curves are symmetric and no rectification is observed.
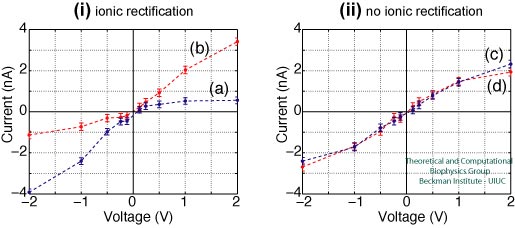 |
Figure 3. I-V curves for 1 nm radius nanopores immersed in 1 M KCl. Panel (i) shows the IV curves for crystalline (blue) and raw cut (red) pores, both pores producing rectification. Panel (ii) shows the IV curves for two annealed pores, both pores producing a symmetric curve without rectification. |
Atomic details of ionic rectification
As described above, non-annealed pores, such as crystalline and amorphous raw cut pores, produce ionic rectification. The question arises, why non-annealed pores produce ionic rectification, while annealed pores produce ohmic responses? What is different between non-annealed and annealed pores? The main difference is the surface.
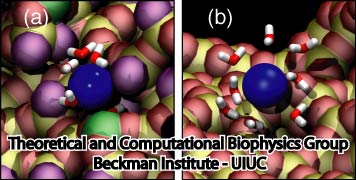 |
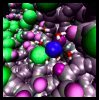
Figure 4. Silica-ion interactions depend on surface details. (a) K+ ion in amorphous raw cut pore. The ion is partially dehydrated and adsorbed into the surface. (b) K+ ion in annealed pore. The ion is not adsorbed, keeping its solvation shell. K+ is pictured in blue. Silica atoms are colored as follows: non-dangling silicon in yellow, non-dangling oxygen in red, dangling silicon in green and dangling oxygens in purple. Water molecules are shown in licorice representation (oxygen red, hydrogen white). |
By visual inspection of the MD trajectories, simulations involving non-annealed pores showed ion binding to the silica walls. However, simulations with annealed pores did not show any ion binding. Figure 4 shows snapshots of a K+ ion when translocating an amorphous raw cut pore and an annealed pore. In Figure 4a , the K+ ion is adsorbed at the surface. The presence of dangling atoms provides an ion-binding spot that dehydrates and retains the K+ ion. Figure 4b shows a K+ ion when translocating an annealed pore, the K+ ion is not adsorbed and kept its solvation shell during the entire translocation. Figure 5 shows the locations where ionic residence times are higher than 20 ps for a crystalline pore and an annealed pore. It is clear that, for non-annealed pores, ions that move close to the silica surface are eventually adsorbed and then released, while annealed pores do not adsorb ions.
 |
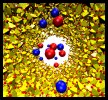
Figure 5. Ion adsorption on silica. Figures show locations where K+ ions (blue) and Cl- ions (red) are adsorbed in crystalline pore (a) and annealed pore (b). Silica is presented as yellow tetrahedrons. |
The atomic detail information provided by MD simulations allowed us to observe the ion binding within the nanopores. Besides that, we performed further analyses, such as the radial ionic concentration inside the pore, amount of current near the wall, ion residence time and electrostatic contributions of every component of the system. Altogether, the results show that ionic current rectification is due to an asymmetric distribution of ion binding spot at the silica surface. For more information is available in our recent paper.
Movies
 |
Movie 1. Ion conduction through annealed and non-annealed pores. (mpg 1.2M)This movie shows MD simulations of ion conduction through an annealed pore (left) and a raw cut pore (right). K+ ions are pictured in blue, Cl- ions in red, dangling oxygens in purple, dangling silicons in green. Both simulations were performed using 1 M KCl and a +1 V bias. Due to the presence of dangling atoms, ions are adsorbed at the surface of non-annealed pore (right). The pore without dangling atoms (left) cannot adsorb ions. Each trajectory shows 5 ns of MD simulation. |
 |
Movie 2. Ion conduction through amorphous raw cut pore. (mpg 3.8M)This movie shows a MD simulation of ion conduction through a raw cut amorphous pore. K+ ions are pictured in blue, Cl- ions in red, and the silica structure is presented as yellow tetrahedra with red vertices. The simulation was performed using 1 M KCl and a +1 V bias. The raw cut surface allows adsorption of either K+ or Cl- ions. The movie shows the last 5 ns of a 30 ns MD simulation. |
 |
Movie 3. Dehydration of K+ ion . (mpg 1.1M)This movie shows a K+ simulation through a raw cut pore. The K+ ion is pictured in blue, dangling oxygens in purple, dangling silicons in green and non-dangling atoms in gray. Only water molecules within 0.3 nm distance from the K+ ion's center are shown (in licorice representation). Initially, the K+ ion moves through the nanopore and keeps its hydration shell. When the ion moves near the nanopore surface, its water shell being partially removed. Then, the ion is released and its hydration shell restored. |
 |
Movie 4. Ion rectification in crystalline pore. (mpg 2.2M)This movie shows two MD simulations of ion conduction through crystalline pore under +1 V (left) and -1 V (right) biases. K+ ions are pictured in blue, Cl- ions in red, dangling oxygens in purple, dangling silicons in green. As the simulations progress, the number of ions inside the pore becomes higher at -1 V than at +1 V bias. Each trajectory shows 10 ns of MD simulation. |
Publications
Investigators
Related TCB Group Projects
Page created and maintained by Eduardo R. Cruz-Chu.


