Translocation of DNA through Synthetic Nanopores
Electric detection of individual DNA molecules with a nanopore
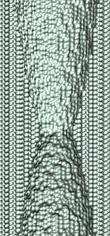
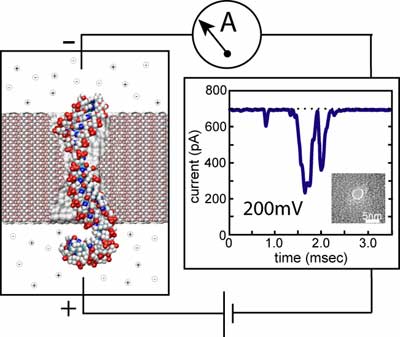 Experimental system for detecting single DNA molecules with a nanopore. The insert shows a transmission
electron micrograph of the pore sculptured by a highly focused electron
beam
(more).
Experimental system for detecting single DNA molecules with a nanopore. The insert shows a transmission
electron micrograph of the pore sculptured by a highly focused electron
beam
(more).The figure to your left illustrates schematically a system for measuring characteristic ionic currents for a pore that conducts DNA. A single nanopore separates two compartments filled with salt buffer and connected to Ag-AgCl electrodes. A constant voltage bias is applied between the two electrodes, inducing a steady-state ionic current through the pore, which is measured by the amplifier. Adding DNA to the negatively biased compartment is observed to cause transient reductions of the ionic current, like the one shown in the figure. This reduced conductance is associated with the translocation of DNA through the pore, which partially blocks the ionic current.
Using a similar set-up, Kasianowicz and co-workers
(![]() )
measured, for the first time, the blockage currents of single-stranded
RNA and DNA electrophoretically driven through the transmembrane pore
of an alpha-hemolysin channel, which was suspended
in a lipid bilayer. Statistical analysis of many such
blockage currents allowed the researchers to discriminate different
sequences of RNA
(
)
measured, for the first time, the blockage currents of single-stranded
RNA and DNA electrophoretically driven through the transmembrane pore
of an alpha-hemolysin channel, which was suspended
in a lipid bilayer. Statistical analysis of many such
blockage currents allowed the researchers to discriminate different
sequences of RNA
(![]() ) and DNA
(
) and DNA
(![]() )
homopolymers, as well as the segments of purine and pyrimidine
nucleotides within a single RNA molecule
(
)
homopolymers, as well as the segments of purine and pyrimidine
nucleotides within a single RNA molecule
(![]() ).
A single nucleotide resolution has been demonstrated for DNA
hairpins
(
).
A single nucleotide resolution has been demonstrated for DNA
hairpins
(![]() ,
,
![]() ),
raising the prospect of creating a nanopore sensor capable of reading
the nucleotide sequence directly from a DNA or RNA strand.
Recent advances in semiconductor nanotechnology allow one to
manufacture pores with nanometer-size diameters using highly focused
ion (
),
raising the prospect of creating a nanopore sensor capable of reading
the nucleotide sequence directly from a DNA or RNA strand.
Recent advances in semiconductor nanotechnology allow one to
manufacture pores with nanometer-size diameters using highly focused
ion (![]() )
and electron
(
)
and electron
(![]() ,
,
![]() ,
,
![]() )
beams. These nanopores have been used as
Coulter counter
devices for detecting single DNA molecules, resolving their
length and diameter.
So-called ionic current blockades measured for synthetic nanopores differ from their alpha-hemolysin analogs. For synthetic nanopores observed blockades
presently show irregular shapes due to
fluctuations of the reduced current within one blockade event; some
blockades have a positive spike of the ionic current above the open
pore level at the end of the blockade.
)
beams. These nanopores have been used as
Coulter counter
devices for detecting single DNA molecules, resolving their
length and diameter.
So-called ionic current blockades measured for synthetic nanopores differ from their alpha-hemolysin analogs. For synthetic nanopores observed blockades
presently show irregular shapes due to
fluctuations of the reduced current within one blockade event; some
blockades have a positive spike of the ionic current above the open
pore level at the end of the blockade.
Setting up an MD simulation
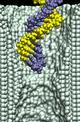
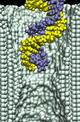
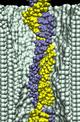
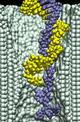
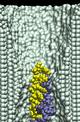
Sequencing DNA strands with a nanopore device has not been achieved yet. As A, C, G, and T DNA nucleotides differ from each other by only a few atoms, in order to relate the sequence of DNA to the measured electrical signals, it is essential to characterize the conformations of DNA inside the pore in atomic detail. At present, MD is the only methodology that can provide realistic images of microscopic events taking place inside the nanopore. Atom by atom, we build microscopic models of the experimental systems and simulate, adapting the methodology developed by us for membrane proteins, translocation of DNA through pores in synthetic membranes. The figure below illustrates a typical procedure for setting up an MD simulation of DNA translocation through a silicon nitride pore.
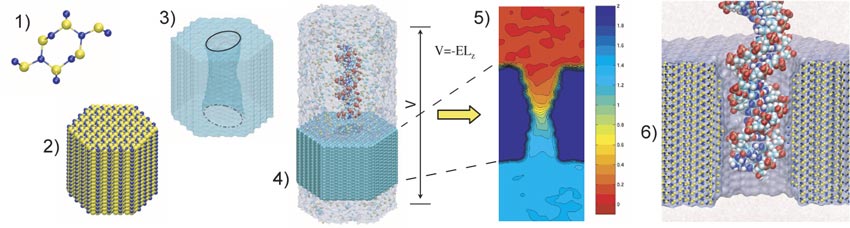
To construct a microscopic model of a nanopore, we first build a
silicon nitride membrane by replicating a unit cell of a beta-silicon nitride crystal
(1) and (2). By removing atoms from the silicon nitride membrane, we produce pores of
symmetric double-conical (hourglass) shapes with radii that correspond
to experiment (3). After placing a DNA molecule in front of the pore, we
add water and ions on both sides of the membrane (4). The final systems
measure from 10 to 30~nm in the direction normal to the membrane and
include up to 200,000 atoms. To accomplish MD simulations on a
system comprising of DNA and silicon nitride, the molecular force field
describing water, ions, and nucleic acids
(![]() ) is combined
with the MSXX molecular force field for silicon nitride
(
) is combined
with the MSXX molecular force field for silicon nitride
(![]() ).
The
protocols of the simulation are described in detail
elsewhere
(
).
The
protocols of the simulation are described in detail
elsewhere
(![]() ,
,
![]() ).
When a uniform electrical field is applied to all atoms in our system,
it induces, at the beginning of the simulation, a rearrangement of the
ions and water that focuses the electrical field to the vicinity of
the membrane, neutralizing the field in the bulk. The resulting
voltage bias V across the simulated system depends both on the
magnitude of the applied field E and the dimension Lz of the
system in the direction of the field, i.e., V=-ELz;
the electrostatic potential near the pore is not uniform (5).
The gradient of this electrostatic potential drives DNA through the
nanopore (6).
).
When a uniform electrical field is applied to all atoms in our system,
it induces, at the beginning of the simulation, a rearrangement of the
ions and water that focuses the electrical field to the vicinity of
the membrane, neutralizing the field in the bulk. The resulting
voltage bias V across the simulated system depends both on the
magnitude of the applied field E and the dimension Lz of the
system in the direction of the field, i.e., V=-ELz;
the electrostatic potential near the pore is not uniform (5).
The gradient of this electrostatic potential drives DNA through the
nanopore (6).
Translocation of double stranded DNA (dsDNA) through Si3N4 pores
DNA - nanopore interaction reduces the ionic current
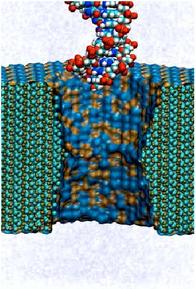
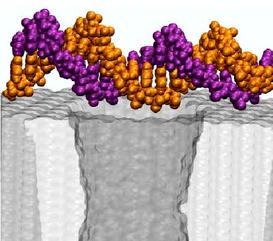
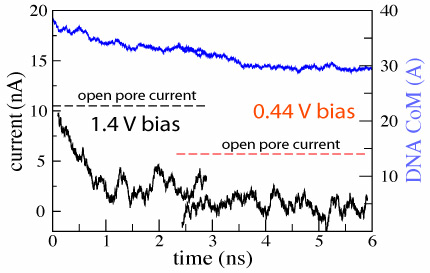
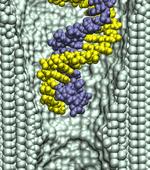
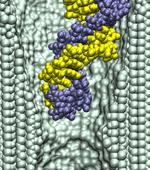
Applying a 1.3~V (or larger) bias over a 5.2-nm-thick membrane we can observe, within the time scale of a MD simulation, a full permeation of a short (20-60 base pairs) DNA fragment through nanopores. A typical translocation event is illustrated by movie. At the beginning of the simulation, a 20 base pair fragment of dsDNA is placed in front of a 2.2x2.6 nm2 pore. Within the first 2~ns, the end of DNA nearest to the pore is pulled into the pore by its charged backbone. The rest of the molecule follows that end, which, after 4 ns, encounters the narrowest part of the pore. At this point, the terminal Watson-Crick base-pair splits, and the freed nucleotides adhere with their bases to the surface of the pore. The translocation proceeds further until it halts after 20~ns. At this point, the three Watson-Crick base-pairs that were first to enter the pore are split; one of the terminal bases continues to adhere strongly to the pore surface. The system is driven out of this metastable conformation by increasing the voltage bias from 1.4 to 4.4~V for 0.3~ns (approximately after 30~ns from the beginning of the simulation). Subsequently, the simulation was continued at a 1.4~V bias. DNA slowly exits the pore, while one of the bases holds firmly to the surface of the pore. After about 50~ns, most of the DNA has left the pore, but a few bases remain attached to the pore surface; nine of twenty base-pairs are split.
In addition to driving DNA through the nanopore, the electric field
induces displacements of ions, forcing them to move through the pore
in opposite directions. When DNA enters the pore, it reduces the ionic
current; however, after the DNA translocation is completed, the ionic
current recovers to the open pore level.
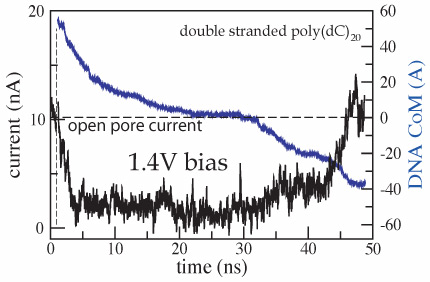
The ionic current can be computed from a MD trajectory by summing up
local displacements of all ions over a time interval Δt:
![]()
where zi and qi are the z coordinate and the charge of atom
i, respectively; Lz is the length of the simulated system in the
direction of the applied electric field (the z axis in our case);
the sum runs over all ions
(![]()
![]() ).
In the figure
we plot the ionic current (black) and the
z coordinate of the DNA center of mass (blue) versus time for the MD
trajectory illustrated by the
movie. The
very first part of the figure (time < 1 ns) corresponds to a
simulation in which DNA does not block the ionic current. When DNA
is placed in front of the pore, it is rapidly captured by the pore,
which is reflected by the reduction of the ionic current. When DNA
translocates through the membrane, the level of total ionic current
appears to be correlated with the DNA velocity inside the pore: the
faster DNA moves, the less it blocks the ionic current. The current
returns to the open pore level after most of the DNA has left the pore,
although some DNA remains inside the pore at the end of the simulation.
).
In the figure
we plot the ionic current (black) and the
z coordinate of the DNA center of mass (blue) versus time for the MD
trajectory illustrated by the
movie. The
very first part of the figure (time < 1 ns) corresponds to a
simulation in which DNA does not block the ionic current. When DNA
is placed in front of the pore, it is rapidly captured by the pore,
which is reflected by the reduction of the ionic current. When DNA
translocates through the membrane, the level of total ionic current
appears to be correlated with the DNA velocity inside the pore: the
faster DNA moves, the less it blocks the ionic current. The current
returns to the open pore level after most of the DNA has left the pore,
although some DNA remains inside the pore at the end of the simulation.
 d=2.4±0.2 nm; 1.4 V / 5.2 nm; 3 ns total(1.5M) |
 d=2.4±0.2 nm; 0.44 V / 5.2 nm; 4 ns total (1.8M) |
|
We have demonstrated so far that translocation of DNA through a
synthetic nanopore results in a transient reduction of the ionic
current. The reverse conjecture, i.e., that the transient reduction of
the ionic current indicates DNA translocation through a nanopore, is
not always valid. As the electrical field in the bulk of the
electrolyte is zero, one can assume that DNA approaches the pore by
diffusion, and, hence, the conformation in which DNA collides with the
pore for the first time is random. Hence, the starting configuration
in which DNA is placed in front of the pore normal to the surface of
the membrane represents only a fraction of DNA's first encounters
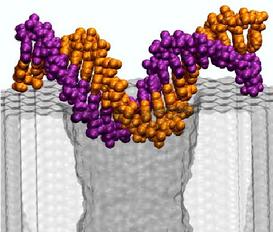
with the nanopore. The other extreme case would be for DNA to approach
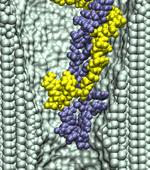
the pore in the conformation shown above, i.e., parallel to the
surface of the membrane.
We started our next simulation from such conformation, placing the
same 20 base pair fragment of dsDNA 12 A away from the membrane.
Within 3 ns, a 1.4 V bias drove DNA into the mouth of the pore
(movie).
The ionic current was observed to
drop by 75%, which is comparable to the level of the current blockade
when DNA permeates the pore
(figure). Thus, by
comparing the results of the two MD simulations, we learn that large
blockades of the ionic current do not necessarily indicate DNA
translocation through a synthetic nanopore, implying that the ionic
current readout is ambiguous in the case of synthetic nanopores. This
apparent ambiguity can be resolved when instead of a silicon nitride
membrane, the pore is made in a multi-layered silicon wafer, in which
a thin layer of silicon dioxide is sandwiched between two layers of
doped silicon. When DNA is driven through such a pore, it produces
two independent voltage signals in the doped silicon layers, allowing
one to unambiguously differentiate translocation of DNA from the
obstruction of the pore mouth
(![]() ).
).
Threshold diameter for translocation of dsDNA is 2.5 nm at small fields
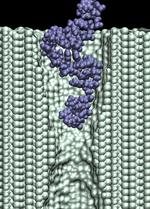
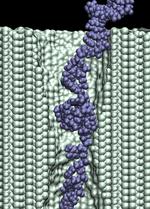
To find out what is the smallest pore dsDNA could translocate through, we simulated the 1.4 (movie), 2.0 (movie), and 3.0 (movie) nm diameter pores combined with one 58-bp dsDNA helix. To shorten the translocation times to a practical duration, the simulations were done at 1.3 V. As a reference point for DNA movement through a pore, we use the DNA center of mass (CoM). Although describing the conformation of a 58-bp DNA helix using a single variable can be ambiguous, in our case, CoM faithfully illustrates the DNA permeation through a pore: when DNA fails to permeate the pore, its conformation is similar to that of a canonical double helix, whereas when DNA permeates the pore, the changes of the CoM position are much bigger than the shift of the CoM due to stretching, bending, or partial unzipping of the double helix.
 |
 d = 2.0 nm; 1.4 V / 10.2 nm; 6.4 ns duration (4.7M) |
 d = 1.4 nm; 1.4 V / 10.2 nm; 5.8 ns total (3.8M) |
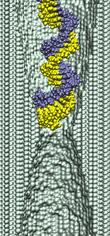
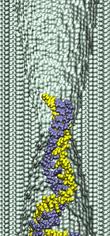
The figure above shows the position of the dsDNA CoM relative to the center
of the silicon nitride membrane against time. Within the first few nanoseconds,
the electric field drove dsDNA into the pores (movies: 1.4 nm pore, 2.0 nm pore);
the wider pore
facilitated faster translocation. Due to their conical shapes, both
pores narrow toward the center of the membrane, which slowed DNA
translocation. After about 4.5 ns, the translocation halted in both
simulations before the DNA arrived at the narrowest part of the
pores. The snapshots included in the inset illustrate the
conformations of dsDNA at the end of these simulations. Notice that
dsDNA traveled a longer path inside the wider pore suggesting that the
translocation halts at a particular cross section. To ascertain if the
translocation halted at the same cross section in both pores, we plot
in the inset of the figure the local radius of the pore around the
first DNA base pair. In both simulations, the translocation of dsDNA
halted when the pore narrowed to 1.25 ± 0.1 nm radius (or 2.5 nm diameter).
So, we conclude that pores with d < 2.5 nm are impermeable to dsDNA for fields < 1.3
V / 10 nm. This prediction has been confirmed by experiment
(![]() ).
).
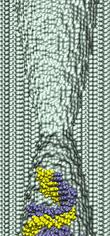
High electric fields can force dsDNA through pores impermeable at smaller fields
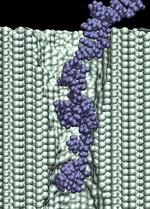
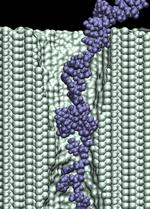
In order to determine if a higher electric field could drive dsDNA through the same pores, we continued our simulations applying a 6.5 V transmembrane bias. In the figure below, we plot the position of the dsDNA CoM against the simulation time. The results of these simulations suggest that dsDNA can permeate both pores at a sufficiently high voltage. In the case of a 2.0 nm diameter pore, the 6.5 V bias deformed the DNA helix, shifting one of the strands relative to the other by approximately one nucleotide, while preserving the hydrogen bonds between strands. Such stretching and shifting reduces the effective diameter of a double helix, allowing it to pass through the constriction of the pore without unzipping (movie). In the case of the 1.4-nm-diameter pore, 6.5 V unzipped dsDNA before it reached the narrowest part of the pore. After denaturing, one of the two strands passed through the 1.4 nm constriction, while the other strand remained at the same place where the unzipping occurred (movie).
 |
 d = 2.0 nm; 6.5 V / 10.2 nm; 3.0 ns total (3.8M) |
 d = 3.0 nm; 1.4 V / 10.2 nm; 18.9 ns total ( 17M) |
 d = 1.4 nm; 6.5 V / 10.2 nm; 13.2 ns total ( 11M) |
In contrast, we found that dsDNA permeates a 3.0 nm
radius pore at 1.3 V (the blue triangle trace in the figure above).
Within the first 5 ns, the field drove dsDNA into the 3.0 nm diameter
pore with a speed comparable to that inside the 1.4 nm and 2.0 nm
pores (movie). In the 3.0 nm pore simulation,
however, the translocation of DNA did not halt before reaching the
center of the membrane. Instead, after about 11 ns, one end of the DNA
helix passed through the 3.0 nm constriction. Shortly following that,
this end adhered to the surface of silicon nitride on the other side
of the pore (z < 0). Such surface adhesion of nucleosides is
attributed to hydrophobic interaction between the DNA and nanopore and
has been described in depth (). Driven by the field, the rest of the
DNA helix continued the move through the pore, deforming the double
helix of DNA into a loop (movie). A translocation like that was reported
earlier
(![]() see also movie).
see also movie).
Voltage threshold for translocation of dsDNA
To establish the threshold field required to drive dsDNA through the pore, we restarted our simulation of the 2.0 nm diameter pore from the conformation shown here. In the figure below we plot the dsDNA center-of-mass against time for a 1.3 (movie), 2.6 (movie), 3.2 (movie), 3.9 (movie) and 6.5 V (movie) bias. These results indicate that dsDNA permeates a 2.0 nm diameter pore for voltages > 2.6 V.
 |
 d= 2.0nm; 1.3 V / 10.2 nm; 6.4 ns total; (4.7M) |
 d= 2.0nm; 2.6 V / 10.2 nm; 8.0 ns total; (6.1M) |
 d= 2.0nm; 3.2 V / 10.2 nm; 8.2 ns total; (8.5M) |
 d= 2.0nm; 3.9 V / 10.2 nm; 13.4 ns total; ( 13M) |
 d= 2.0nm; 6.5 V / 10.2 nm; 3.0 ns total; (3.8M) |
In all MD simulations, we observed partial
unzipping of the DNA ends when they pass by the narrowest part of the
pore. The length of the unzipped fragment was found to vary from one
simulation to the other, but typically was from 2 to 12
nucleotides. The 3.9 V path in the figure is longer than the 3.2 V path because
at 3.9 V, dsDNA partially unzipped before reaching the center of the
membrane. After both DNA strands had passed through the center of the
membrane (12.5 ns), the translocation at 3.9 V proceeded faster than
that at 3.2 V, as indicated by the slopes of the curves.
The existence of such voltage threshold and its magnitude for a 2.0 nm
diameter pore were confirmed experimentally
(![]() ).
).
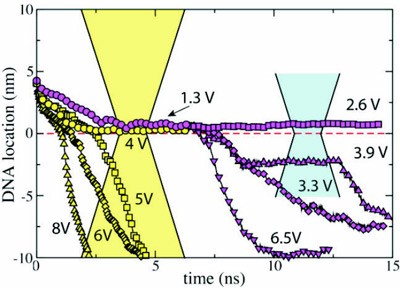
Scaling of the voltage threshold
To discover the microscopic origin of the field threshold for
dsDNA translocation, we carried out MD simulations of dsDNA translocations
through a 2.0 nm diameter pore in both 10 and 20-nm thick membranes; the
latter pore has an elliptic 1.8x2.2 nm2 cross-section in correspondence
with the experiment carried out by our collaborator.
The figure below shows the position of the DNA leading
edge relative to the center of the membrane against the simulation
time; the symbols identify simulations carried out at different
biases. For both pores, we observed a voltage threshold for permeation
of dsDNA that agrees quantitatively with experiment
(![]() ).
Although the average diameter of both pores is 2.0 nm, the cross-section of the pore
in the 20 nm thick membrane is an ellipse. The major axis of the
ellipse determines the effective diameter of the pore for permeation
of dsDNA. Therefore, the scaling of the threshold voltages with the
membrane thickness is slightly sublinear.
Movies: 10 nm thick membrane and 1.3, 2.6, 3.2, 3.9, and 6.5 V bias; 20 nm thick membrane and 4, 5, 6, and 8 V bias.
).
Although the average diameter of both pores is 2.0 nm, the cross-section of the pore
in the 20 nm thick membrane is an ellipse. The major axis of the
ellipse determines the effective diameter of the pore for permeation
of dsDNA. Therefore, the scaling of the threshold voltages with the
membrane thickness is slightly sublinear.
Movies: 10 nm thick membrane and 1.3, 2.6, 3.2, 3.9, and 6.5 V bias; 20 nm thick membrane and 4, 5, 6, and 8 V bias.
 |
 d = 2.0 nm; 4 V / 20 nm; 6.5 ns total (1.2M) |
 d = 2.0 nm; 5 V / 20 nm; 6.2 ns total (1.5M) |
 d = 2.0 nm; 6 V / 20 nm; 5.2 ns total (1.3M) |
 d = 2.0 nm; 8 V / 20 nm; 4.4 ns total (945K) |
To further investigate the origin of this sharp voltage threshold, we
plotted the electrostatic potential along the pore axis V(z) against
the distance from the center of the membrane (z-zo) in a pore
containing only electrolyte and no DNA for all simulation conditions
studied (we have previously determined that taking DNA into account
does not alter significantly the distribution of the electrostatic
potential ![]() ). Scaling V(z) with the applied bias Vbias
and (z-zo) with the membrane width Lmem converged
all data to one universal curve (see panel (a) below).
We find that the following expression:
). Scaling V(z) with the applied bias Vbias
and (z-zo) with the membrane width Lmem converged
all data to one universal curve (see panel (a) below).
We find that the following expression:
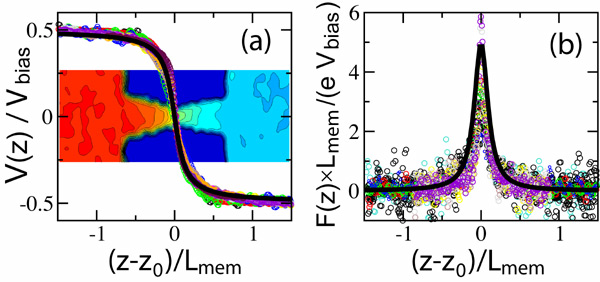
V(z) / Vbias = 1/π Arctan(-b(z-zo) / Lmem)
approximates the variation of the electrostatic potential across the
membrane, where the geometrical factor b was found to vary from 8 to
12 at 1M KCl. Fitting this function to all data points yielded b =
9.4. The scaled force acting on an elementary charge (q =
1.6×10⁻¹⁹) is plotted in the panel (b). The force drops off
very abruptly away from the membrane center, which explains why the
threshold for dsDNA permeation is so sharp. Thus, at a 1.3V bias,
permeation of dsDNA halts when the pore narrows to 2.5 nm in diameter
(figure); the
force acting on the leading edge of DNA at that conformation is
< 20 pN. At 2.6 V, the location of the DNA leading edge is closer to the
membrane center than at 1.3V (figure);
the force acting on the leading
edge of DNA (about 45 pN), but still insufficient to stretch the helix.
As the bias increases, the force eventually exceeds 60 pN, stretching
DNA in the pore towards the membrane center. As the stretching
proceeds, the force on the leading edge increases as (z-zo)2 so that
once the DNA passes the threshold determined by the force acting on a
leading edge of the molecule, it is unlikely to pull back from the
pore. More details can be found in
(![]() ,
,
![]() ).
).
Influence of the solution pH on translocation of dsDNA
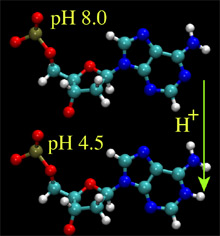
At low pH, atom N1 of nucleoside A and atom N3 of nucleoside C are likely to accept a proton from the solution, neutralizing the charge of the entire nucleotide. The pKa values of these protonation sites are about 3.8 and 4.5, respectively. The protonation of the nucleosides disrupts a delicate balance of the forces holding together the double helix; at very low pH, the helix denatures. At moderate pH (3-5), one can expect that only a fraction of A and C nucleosides is protonated, favoring, overall, the double helical organization of DNA, but altering physical properties of the helix, if compared to the pH 8.0 conditions. To investigate how these affect the electromechanics of DNA in a nanopore, we set up two MD simulations, in which all or a half of all A nucleotides in our 58bp helix were protonated. This effectively corresponds to a simulation carried out at pH4 (20% of all nucleosides de-protonated) and pH4.5 (10%), respectively. For the initial conformation of DNA we chose the final state from the 6.4ns simulation, in which a 1.3V bias drove dsDNA into a 2.0nm diameter pore (movie). We have previously established that, starting from this conformation, a 2.6 V bias cannot drive dsDNA through the pore at the pH8 conditions (figure). After adding protons to the selected nucleosides, we resumed simulations at a 2.6V bias. The results of the simulations are illustrated by the figure and three movies below.
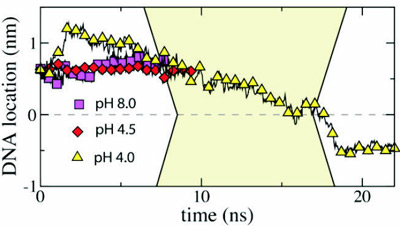 |
 pH 8.0; d = 2.0 nm; 2.6 V / 10.2 nm; 8 ns total; (1.3M) |
 pH 4.5; d = 2.0 nm; 2.6 V / 10.2 nm; 9.5 ns total; (1.6M) |
 pH 4.0; d = 2.0 nm; 2.6 V / 10.2 nm; 26 ns total; (4.3M) |
Translocation of single stranded DNA (ssDNA) through Si3N4 pores
At a 1.4 V bias, we observed only a partial permeation of a 58-nucleotide ssDNA through a 1.4 nm diameter pore (movie). After 8 ns, the base of the leading nucleotide adheres to the surface of silicon nitride, dramatically slowing down the translocation. This simulation was continued applying, in addition to a 1.4 V bias, a traverse force that kept the leading nucleotide of ssDNA at the center of the pore (movie), resulting in a moderate increase of the translocation velocity. Next, we continued the simulation applying a 6.5 V bias (the bias force was switched off), during which the leading nucleotide of the DNA strand passed the pore constriction (movie). The bias was switched back to 1.4 V after 18 ns, causing a partial retraction of the strand from the pore (movie). Switching the bias back to 6.5 V forced DNA into a stretched conformation (movie).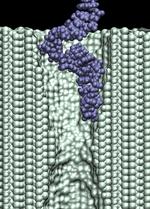 d=1.4 nm; 1.4 V / 10.2 nm; 17.6 ns total (9.5M) |
 d=1.4 nm; 1.4 V / 10.2 nm; 2.8 ns total (1.7M) |
 d=1.4 nm; 6.5 V / 10.2 nm; 18.0 ns total ( 11M) |
 d=1.4 nm; 1.4 V / 10.2 nm; 5.3 ns total (3.4M) |
 d=1.4 nm; 6.5 V / 10.2 nm; 14.8 ns total (8.6M) |
In addition to the driving electric force, three types of interactions affect the
duration of the translocation: (i) mechanical friction between DNA and the pore;
(ii) reduction of the driving force by the counter ion
condensation, decreasing the DNA effective charge;
and (iii) the hydrophobic adhesion of bases
to the pore surface. On a time-scale of 10 ns, hydrophobic adhesion is the predominate force
affecting the duration of the translocation of ssDNA and RNA strands
when the diameter of the pore is larger than the diameter of the strand
(![]() ,
,
![]() ).
).
Publications
Investigators
Simulations ExperimentRelated TCB Group Projects
Page created and maintained by Aleksei Aksimentiev.


