VMD-L Mailing List
From: Nifeng Guo hui (nifenggaohui_at_gmail.com)
Date: Mon Nov 03 2014 - 15:29:25 CST
- Next message: Axel Kohlmeyer: "Re: Fwd: namd-l: Why RDF increases as r increase instead of constant"
- Previous message: John Stone: "Re: Interactive Display of Molecular Orbitals"
- In reply to: Axel Kohlmeyer: "Re: Fwd: namd-l: Why RDF increases as r increase instead of constant"
- Next in thread: Axel Kohlmeyer: "Re: Fwd: namd-l: Why RDF increases as r increase instead of constant"
- Reply: Axel Kohlmeyer: "Re: Fwd: namd-l: Why RDF increases as r increase instead of constant"
- Messages sorted by: [ date ] [ thread ] [ subject ] [ author ] [ attachment ]
Hello, Axel and Tim
I analyze RDF in production run of 10 ns. (After energy minimization and
NVT, NPT Equilibration simulation.) In my understanding of RDF, after
certain distance from the reference point, the particles will distribute
evenly which means water molecules are not attracted or repelled by the
protein molecule. Thus, the water density will appear as a horizontal line.
However, it's hard to explain that RDF increases to 28 anstrom and suddenly
becomes zero.
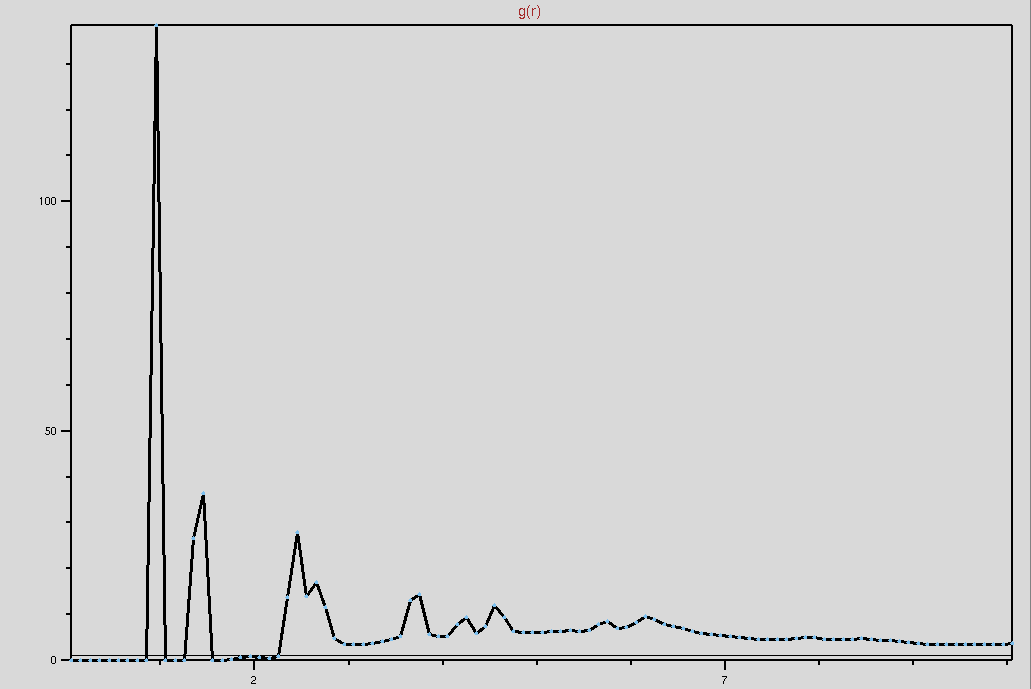
Now, I change the code in "Section 2" as "name OH". The plot seems like
understandable. So does this mean the code for "water" in "Section 2" is
incorrect? I attach the new plot. Please take a look at it. Thanks.
Peng
2014-11-03 0:58 GMT-06:00 Axel Kohlmeyer <akohlmey_at_gmail.com>:
> On Sun, Nov 2, 2014 at 11:19 PM, Nifeng Guo hui <nifenggaohui_at_gmail.com>
> wrote:
> > Hi Tim,
> > Thanks for the explanation. Now I follow your instruction and plot it
> again.
> > It still does not make sense. I use period boundary condition to
> simulate in
>
> well, the problem is very likely not with the g(r) plugin but with
> your expectations. you most certainly don't have a homogeneous
> monoatomic fluid as your system, which will lead to the graphs more
> commonly seen as examples for a g(r). please review the definition of
> the g(r) (i.e. what the graph means, not what it typically looks like)
> and compare it to the structure you are feeding into VMD. i am very
> confident that what you see as a graph is correct. it would be
> consistent with a two component system that is mostly separated.
>
> > a cubic box with dimension 50. The molecule size is
> > cellBasisVector1 48.12900161743164 0 0
> > cellBasisVector2 0 42.979000091552734 0
> > cellBasisVector3 0 0 43.9109992980957
> > cellOrigin 0.5063787698745728 1.1608952283859253 0.11323882639408112.
> > Please find the picture in the attachment. Thanks.
> > Peng
> >
> > 2014-11-02 19:19 GMT-06:00 Tim Lo <timlo_at_hku.hk>:
> >
> >> Hi Peng,
> >>
> >> By looking at the r-axis, the graph just displays g(r) for the range of
> >> [0, 10]. You should increase "max r" to your desired value, but not
> just use
> >> the default value of 10.0.
> >>
> >> Tim
> >>
> >>
> >> On 2014/11/3 上午 06:01, Nifeng Guo hui wrote:
> >>>
> >>> Dear VMD users,
> >>> We perform one simulation with one protein immersed in water. Now, we
> >>> want to analyze the water distribution around this molecule after
> finishing
> >>> production run. The g(r) GUI Plugin, Version 1.3 was applied to
> calculate
> >>> its function. After I input PSF and DCD files, I put "residue 1 to 36"
> in
> >>> Section 1 and "water" in Section 2. (This protein is composed of 36
> amino
> >>> acids. ) I also tried "protein" for Selection 1. Next, Frames are "0"
> in
> >>> First and "19999" in Last. Then before using compute g(r), I select
> Use PBC,
> >>> Display g(r), and Display int(g(r)). However, the result does not
> reach our
> >>> predictions. The RDF and Coordination number are both increasing
> >>> exponentially as r increase. In our prediction, it supposes to become
> >>> constant. Could you help me find what cause this? Plese also take a
> look at
> >>> the plot in the attachment. Thanks.
> >>> Peng
> >>>
> >>>
> >>>
> >>
> >
>
>
>
> --
> Dr. Axel Kohlmeyer akohlmey_at_gmail.com http://goo.gl/1wk0
> College of Science & Technology, Temple University, Philadelphia PA, USA
> International Centre for Theoretical Physics, Trieste. Italy.
>
- Next message: Axel Kohlmeyer: "Re: Fwd: namd-l: Why RDF increases as r increase instead of constant"
- Previous message: John Stone: "Re: Interactive Display of Molecular Orbitals"
- In reply to: Axel Kohlmeyer: "Re: Fwd: namd-l: Why RDF increases as r increase instead of constant"
- Next in thread: Axel Kohlmeyer: "Re: Fwd: namd-l: Why RDF increases as r increase instead of constant"
- Reply: Axel Kohlmeyer: "Re: Fwd: namd-l: Why RDF increases as r increase instead of constant"
- Messages sorted by: [ date ] [ thread ] [ subject ] [ author ] [ attachment ]


