Fluorescence Microscopy
The optical microscope, invented 400 years ago, throughout these years furnished a tremendous amount of knowledge. In particular, the microscope has been used widely in life sciences. After about 300-year history of instrumenal development and reach harvest of discoveries, it was found by Ernst Abbe in 1873 that the wave nature of light poses a limit to the resolution power of microscopes due to diffraction, a finding which has become known as Abbe's diffraction barrier. However, recently it was realized, most notably through the work of Stefan Hell starting in the 1990-s, that Abbe's barrier can be overcome. As a result, new optical microscopes are emerging now, enabling previously unthinkable high, namely, nanometer, resolution, that are most valuable for biological applications.
Breaking Abbe's Diffraction Barrier
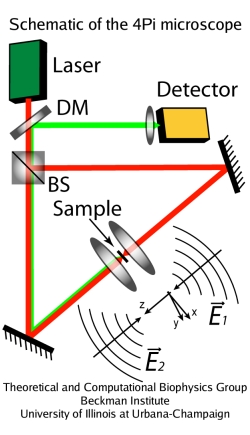 Fig. 1. Principle of the 4Pi microscope.
A confocal microscope, commonly used in fluorescence microscopy studies, eliminates out-of-focus light coming into the detector, improving the imaging; using multi-photon excitation (usually, two-photon), one can slightly increase the resolution power. Despite these tricks, until recently the resolution of optical microscopes remained bounded by the Abbe's diffraction barrier, with the size of the illuminated area limited to approximately 250nm in the focal plane and 500nm in the direction of the optical axis. The state of affairs changed in 1990-s, when new light microscopy concepts were developed that improve the resolution up to about 30nm, thus breaking Abbe's barrier. These techniques include 4Pi microscopy, I5M microscopy, and stimulated emission depletion (STED) microscopy.
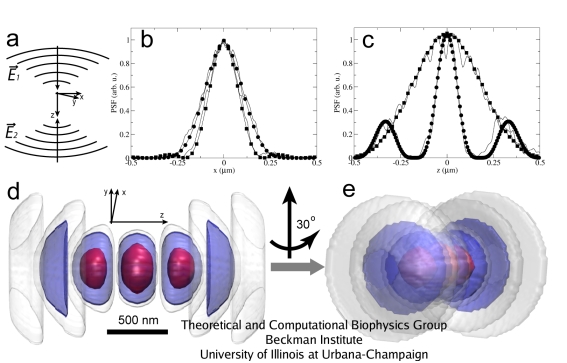 Fig. 2. PSF of the 4Pi microscope (circles), formed by the interference of two coherent light beams (a), is compared to the PSF of the confocal microscope (squares) for radial (b) and axial (c) dimensions. The 4Pi PSF is significantly narrower in the axial dimension. Two 3D views of the 4Pi PSF are shown on (d) and (e). Two-photon illumination is assumed.
The 4Pi microscope achieves its high resolution along the optical axis (about 100nm) by using the coherent light from a laser split into two beams, which are focused at the same point onto a sample. Constructive interference of the two beams enhances the focusing of the light; two-photon illumination is usually employed to further narrow the excitation volume. A newer type of microscopy, STED, allows for even better resolution (30nm) in fluorescent studies, due to the combination of two light pulses separated by a short time: the illumination light pulse and a successive pulse that supresses the fluorescent emission everywhere except the center of the illuminated region. Unlike the 4Pi microscope, STED setups are not available commercially yet. More on the 4Pi and STED microscopes can be found on the web page of Stefan Hell's group at Max Planck Institute for Biophysical Chemistry, Gottingen, Germany, where these microscopes were invented.
Due to the interactions with the elements of the optical system along the light path, the light from each point source is distributed non-uniformly at both the illuminated object and the detector; this is described by the point spread function (PSF) of the optical system. In Fig.2, the 4Pi illumination PSF is demonstrated and compared with that of the confocal microscope. A movie of the 3D rendering of the 4Pi PSF is available here (size:1.2M).
Fluorescence Microphotolysis and Fluorescence Correlation Spectroscopy with the 4Pi Microscope
In biology, light microscopy is the only tool that allows one to image and probe living cells non-invasively. In addition to imaging, optical microscopy can be used for another important task, namely, to study dynamics of cellular components. This is usually achieved with two related techniques, fluorescence microphotolysis (FM) and fluorescence correlation spectroscopy (FCS), both introduced in 1970-s.
In FM, a small area of a fluorescent specimen is illuminated by a focused laser beam, and the fluorescence of the illuminated spot is recorded. The fluorescence changes due to two factors: the light-induced irreversible transition of the fluorescent molecules (``fluorophores'') into a non-fluorescent state (referred to as photobleaching), and diffusion of the fresh fluorophores into the illuminated spot from the surrounding space. In common FM applications, an initial strong and short light pulse that bleaches all fluorophores in the explored area is followed by long weak illumination, when almost no beaching occurs and fluorescence recovery due to diffusion is detected. Continuous FM (CFM) method ( Peters et al.) employs a focused laser beam to continuously illuminate the sample, so that the bleaching and replenishing through diffusion occur at the same time. This makes the analysis of experimental data more complicated, requiring numerical calculations for data analysis, but improves the signal quality and makes CFM a more sensitive and versatile tool than conventional FM.
FCS also employs a focused laser beam to illuminate a small spot of a fluorescent specimen at a small non-bleaching intensity. However, the fluorophore concentration is kept so small that fluctuations in the number of illuminated fluorophores become apparent and can be used to derive diffusion coefficients by a correlation analysis. Both CFM and FCS can be installed on a confocal microscope and combined in the same setup without any further instrumental modifications. However, the techniques differ, and, in fact, complement each other ideally, for instance with respect to range of assessible diffusion coefficients and fluorophore concentration. Thus, FM and FCS have become indispensable tools of cell biology and are employed at an ever increasing pace.
Emergence of techniques like 4Pi microscopy has already provided a new level of detail observed in biological imaging, and promises to bring about a tremendous improvement for FM and FCS. However, to take advantage of the resolution improvement, an appropriate theoretical and computational framework has to be created, due to the non-trivial shape of the 4Pi PSF. This has been the focus of active research in our group, resulting in the development of the theory and computational methods for 4Pi CFM and FCS measurements ( Arkhipov et al.); exemplary results are shown in the figure below.
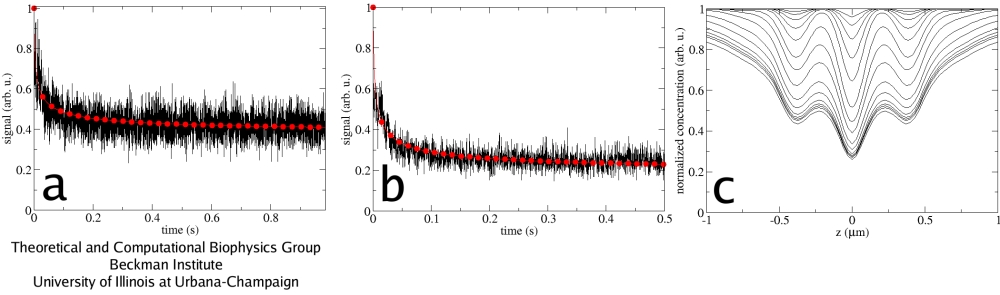 Fig. 3. Fluorescent signal recorded in experiments (black) and calculated numerically (red). Two examples are shown in (a) and (b). In (c), the snapshots of the fluorophore concentration profile along the optical axis are shown for successive time moments.
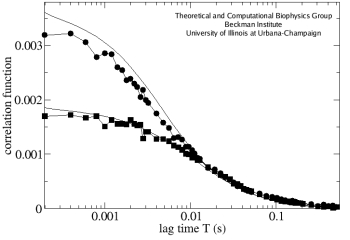 Fig. 4. FCS measurements with the 4Pi (circles) and confocal (squares) microscopes, measured on the same sample. Numerical fits for both cases are shown as solid black lines.
Numerical calculations were validated by measurements on model systems, namely, water-glycerol solutions of GFP. 4Pi conditions or normal confocal conditions were employed together with either single- or two-photon excitation. In all cases experimental data could be well fitted by computed curves for expected diffusion coefficients, even when the signal-to-noise ratio was small due to the small number of fluorophores involved.
The implemented computational framework allowed for calculations with an arbitrary PSF and for an easy fitting of the experimental curves in a broad range of conditions. The fluorescent signals from the CFM experiments were reproduced (Fig.3), as were the correlation functions obtained in the FCS measurements (Fig.4). The values of the GFP diffusion coefficient found in this study (D~1&mum2/s) agreed well between the CFM and FCS measurements, as well as between 4Pi and confocal microscopes. These values also coincide with those found earlier for this test system using a different approach.
Overall, this study for the first time employed the microscopy type that breaks Abbe's resolution limit for FM and FCS. Accordingly, the theoretical and computational framework will contribute to the further unravelling of the cellular nanomachinery which lies at the heart of life and thus holds the key for future progress in biology.
Numerical Approach
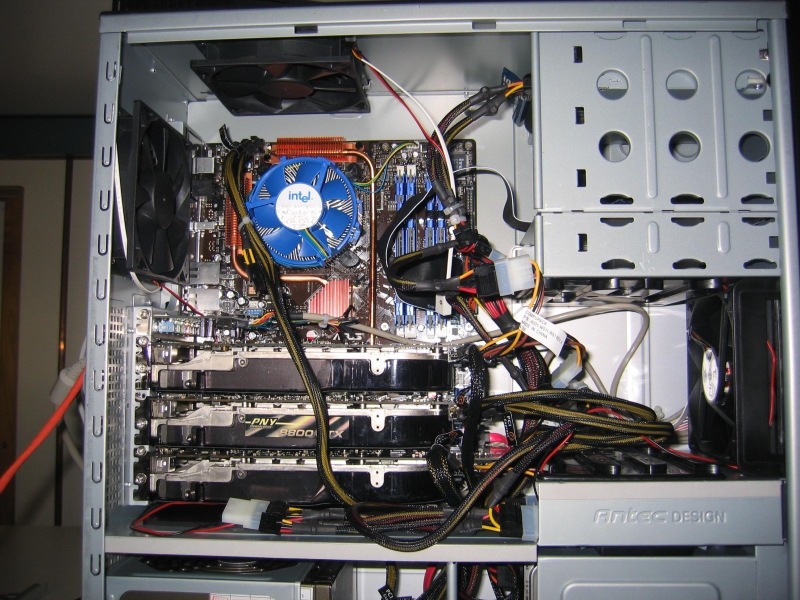 Fig. 5. A system block with three GPUs. Click on figure to enlarge (size:400K).
The numerical algorithm for computing the CFM or FCS data was implemented as a multi-platform program called fmtool. This program is now set up as a VMD plugin, and, thus, can be freely downloaded from our web site. Fmtool is also available separately upon request.
In the numerical algorithm, the PSF of the microscope is projected onto the studied specimen, where distribution of active fluorophores is computed on a grid. The evolution of the concentration is described by a diffusion-reaction equation, a second-order partial differential equation solved numerically using the method of finite differences ( Arkhipov et al.). For the experiments performed, the monitored time was usually 1-10s, and the maximum time step one could use in the numerical solution was 0.1ms. A typical calculation covering 10 seconds of measurement time required 8 minutes of computing time on a single core of an Intel Core 2 Quad CPU running at 2.66~GHz, using the Intel C/C++ compilers version 9.0.
The computing time can be reduced employing parallel processors which require, however, professional support for their installation and operation. Fortunately, another less demanding and much cheaper option is available through the most recent generation of graphical processing units (GPUs) to be found soon in commodity computers. These GPUs offer about a hundred cores on which the needed computations can be carried out as fast as on a computer cluster with as many processors offering nearly teraflops of computer power. A key new feature of the new GPUs is the availability of general purpose compilers. The fmtool code works both on GPUs and on a CPU. The GPU implementation of fmtool performs 12 times faster (on the NVIDIA GeForce 8800GTX GPU) than the CPU-based version (a single core of an Intel Core 2 Quad CPU, 2.66~GHz), 38 seconds versus 8 minutes.
Publications
Investigators
Collaborators
- Reiner Peters, University of Munster, Germany
- Petros Koumoutsakos, ETH Zurich, Switzerland
Page created and maintained by Anton Arkhipov.


