Polymeric nanopores
Overview
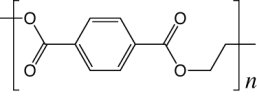
Figure 1. PET chemical structure.
Solid-state nanopores are very small pores with diameters of just few nanometers, that are built from synthetic materials, such as silicon-based glasses or carbon-based plastics. Due to their outstanding properties (resistance to harsh solvent conditions, selectivity for surface modifications, and alterable geometry), solid-state nanopores have been used for a wide range of applications as well as for studying fundamental theories about nanoscale confinement. Here, we will present a brief summary of our recent research about polymeric plastic nanopores.
Polyethylene terephthalate (PET) is a linear polymer widely used in beverage bottles and other plastic containers. The chemical structure of a PET monomer is presented in Figure 1. PET monomers join to form linear polymers that terminate in carboxyl groups, whose protonation state change according to the pH conditions of the environment. Specifically, PET films have been used for building nanopores by irradiating the surface with heavy ions.
PET nanopores have emerged as a nano-scale model system of interest, because of the experimental observation of multiple effects allowing for the control of ion transport properties, i. e., ion current rectification, ion selectivity, and nanoprecipitation. Nevertheless, there is still relatively little known about the atomic dynamics inside the nanopore volume and the effect of the PET surface on the transport properties. In this website, we briefly describe the work that the TCBG has performed to study PET nanopores. For more details, take a look at the publications or contact the investigators listed below.
Building PET nanopore
We have proposed a collapsing-annealing procedure to build all-atom PET bulk structures. First, a variety of PET polymers were generated and arranged into a grid. The PET model was based on the CHARMM force field. Next, the grid was collapsed into a rectangular box by applying 5 pN forces toward the center of the box. The collapsing simulation was performed for 2 ns. To avoid folding of the polymers when they were moving toward the box volume, the temperature was set to 1000 K. The collapsing of the grid at 0, 0.4 and 2 ns is shown in Figure 2.
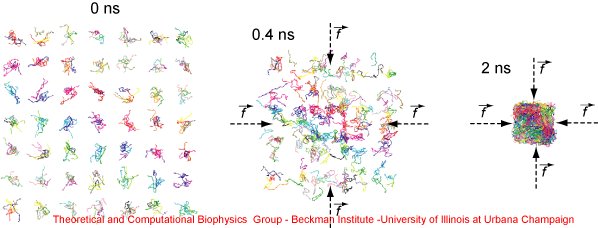 |
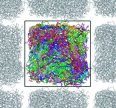
Figure 2. Collapsing PET grid. The snapshots illustrate the collapsing procedure applied to a grid of PET polymers. Initially, different PET polymers are randomly located in a grid of 7 x 7 x 5 points. By applying guiding tclBC forces, the grid is collapsed into a rectangular volume. The snapshots present the collapsing simulation at 0, 0.4 and 2 ns. |
Once the polymers were confined into a rectangular volume, the collapsed structure was annealed to obtain a periodic cell with homogeneous density. Figure 3 shows the PET structure at the beginning (left) and at the end (right) of the annealing cycle. The PET structure is presented in color and the periodic images in gray. First, the PET structure was placed within a periodic cell and simulated for 5 ns at 1000 K. At this temperature, the polymer is fluid and fills the entire cell volume. After that, the temperature was gradually quenched up to 400 K, with a cooling step of 0.2 ns per -100 K. The annealing cycle finished with a 5-ns equilibration at 300 K.
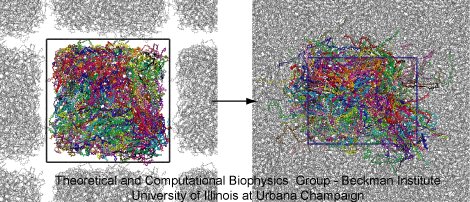 |
Figure 3. Annealing periodic PET. The snapshots illustrate the initial and final steps of the annealing cycle. On the left side, the collapsed PET structure (colors) is located into a periodic box, the periodic images are shown in gray. On the right size, the PET structure after annealing. The final structure has homogeneous density. |
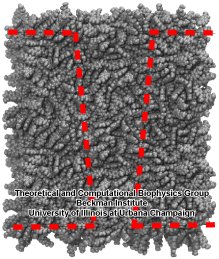 |
Figure 4. Outline of PET nanopore. Through deletion of residues, a conical nanopore is molded into the PET bulk material. |
Ionic Conduction in PET nanopores
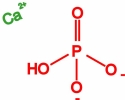
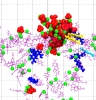
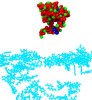
Once the nanopore model was finished, the system was solvated and used to study ionic conduction under different pH conditions and voltage biases. To mimic pH 7, the terminal PET residues in contact with water were deprotonated, resulting in a surface charge of -1.03 e nm-2, which agrees well with experimental values. The system was neutralized by adding counter ions, either K+ or Ca2+. To mimic pH 4, all carboxyl groups remained protonated. Subsequently, K+ and Cl- ions were randomly placed in the solvent compartments, corresponding to 1 M KCl concentration. Figure 5 pictures an atomic model of a PET nanopore immersed in electrolyte solution at pH 7.
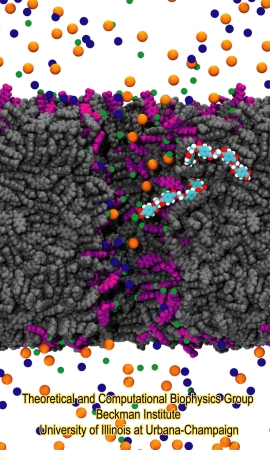 |
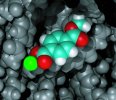
Figure 5. Atomic model of PET nanopore. The figure shows a polyethylene terephthalate nanopore immersed in electrolitic solution. The nanopore bulk material is shown in gray. Negatively charged PET residues are shown in purple. K+, Cl- and Ca2+ ions are shown as blue, red and green beads, respectively. A single PET polymer chain is highlighted, colored in cyan (carbon atoms), red (oxygen atoms) and white (hydrogen atoms). |
Our simulations show strong dependence of ion selectivity on the nanopore surface charge. At pH 4, when the nanopore surface is not charged, the anionic and cationic currents are of about the same magnitude and there is no ion current selectivity. At pH 7, however, where the carboxyl groups are negatively charged, the ion current carried by K+ is larger than the current carried by Cl-.
Also, in the presence of Ca2+ ions at pH 7, the exposed carboxyl groups adsorb the divalent cations. Most Ca2+ ions remained practically immobile, and only a very small fraction of Ca2+ ions was mobile and their contribution to the total ion current was negligible. Furthermore, after Ca2+ binding to the negatively charged surface, the electrostatic potential of the nanopore changed sign and the selectivity for K+ was canceled. More detailed information is available in our publication.
.
Nanoprecipitation
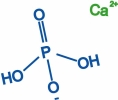
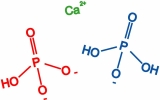
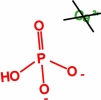
A novel phenomenon has recently been reported in polymeric nanopores. This phenomenon, so-called nanoprecipitation, is characterized by the transient formation of precipitates in the nanopore lumen, producing a sequence of oscillations in the ionic current through the pore. Figure 6 shows a cartoon representation of the ionic current oscillations. Figure 6.a presents a standard experimental setup for nanopore experiments. In the top figure, a nanopore membrane is immersed in phosphate buffer solution. If a voltage bias is applied, the ions flow through the pore establishing a constant ionic current (bottom figure). Figure 6.b presents the nanoprecipitation phenomenon. If the solution contains sub-millimolar concentrations of divalent cations, such as Ca2+, Co2+ or Mg2+, the ionic current is not constant but oscillates, reflecting a sequence of low and high conductance states (Figure 1b - bottom panel).
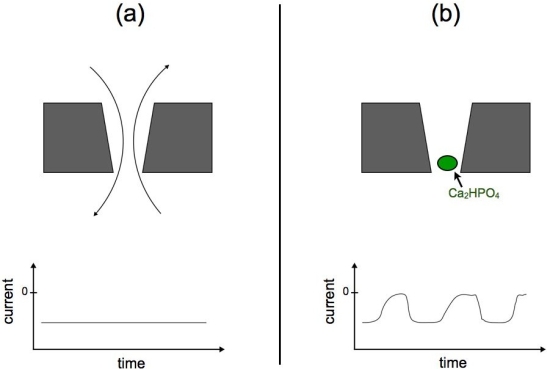 |
Figure 6. Schematic representation of nanoprecipitation oscillations. Panel (a) shows a cartoon representation of ions flowing through a nanopore, the translocation of ions produces a constant ionic current. Panel (b) shows a precipitate blocking the nanopore lumen (green bead). The appearance of precipitates produce oscillations in the measured ionic current. |
Experimentalists demonstrated that the oscillations are due to the formation of small precipitates containing divalent cations and phosphate buffer ions (Figure 1b - top panel). The low conductance state is caused by a precipitate getting clogged in the nanopore (green bead), obstructing the ion flow, while the high conductance state is caused by the removal of the precipitate, resetting the ion flow.
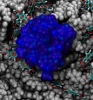
We investigated nanoprecipitation using computer simulations. MD simulations provided an all-atom description of the PET nanopore, phosphate buffer molecules and Ca2+ ions, and were used to study the interplay between pore surface and translocating molecules. Indeed, we were able to observe the formation of precipitates inside the nanopores. Figure 7 shows a nanoprecipitate composed of Ca2+, HPO42- and K+ ions obtained after 150 ns of MD simulation. Overall, our results revealed the atomic events related with nanoprecipitation. Key players are the PET carboxyl groups exposed at the nanopore surface (Figure 7, licorice representation). When deprotonated, carboxyl groups retain Ca2+ ions and act as nucleation centers for precipitation. The precipitate grows around carboxyl groups, blocking the pore entrance and decreasing the flow of ions through the pore.
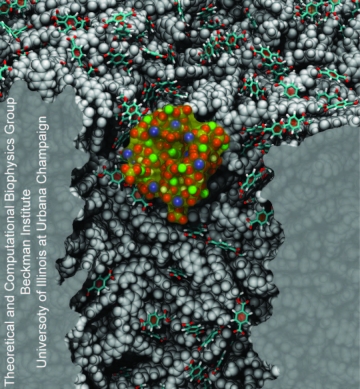 |
Figure 7. Nanoprecipitation inside polymeric nanopores. The snapshot shows a nanoprecipitate in a PET nanopore, the nanopore sliced along the pore axis. PET material is shown as a gray; negatively charged PET residues are shown in licorice representation; K+, Ca2+, and HPO42- ions forming the precipitate are colored as blue, green, and red-yellow beads, respectively; water molecules are not shown. |
As observed in the bottom panel Figure 1.b , the ionic current oscillates between a high conductance state and a low conductance state. The low conductance state is associated with the formation of a solid precipitate in the nanopore. Naturally, a high conductance state indicates that the flow of ions has resumed; thus, high conductance has to be associated with the opening of the pore due to removal of the precipitate. Previously, it was assumed that the precipitate would dissolved inside the nanopore. Based on our MD simulations, we proposed an alternative mechanism, where the entire precipitate exits the pore after being released from the nanopore surface. Our MD simulations showed that the precipitate remains strongly attached to carboxyl groups. However, by reprotonation of the PET carboxyl groups exposed in the nanopore, the precipitate can detach from the PET surface and diffuse out of the pore, leaving the pore open and restoring ion flow. Figure 8 shows a deprotonated carboxyl group being reprotonated. The details of the reprotonation mechanism as well as the precipitation dynamics are describe in more detail in our recent publication.
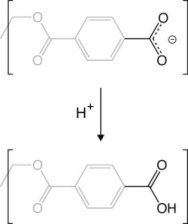 |
Figure 8. Reprotonation of PET carboxyl group. |
Movies
 |
Movie 1. Building bulk PET. (mov 19M)The movie illustrates the collapsing-annealing procedure used to build amorphous PET. In the first stage, 245 PET polymers are arranged into a grid. Each polymer is presented in different color. Then, the grid is collapsed into a rectangular box. In the second stage, the collapsed grid is located into a periodic box and annealed to obtain homogeneous density. The collapsed structure is colored in red and the periodic images in blue. |
 |
Movie 2. Ca2+ adsorption in PET nanopores. (mpg 4.7M)The movie presents 20 ns of a molecular dynamics simulation of ionic conduction under 1 V voltage bias. PET residues with deprotonated carboxyl groups are colored in purple. Ca2+ ions are colored as green beads. K+ and Cl- ions are colored as blue and orange points, respectively. Nanopore bulk material and water molecules are not shown. It can be observed that most Ca2+ ions remain attached to the carboxyl group. One adsorbed Ca2+ ions is highlighted in red. |
 |
Movie 3. Nanoprecipitate inside polymeric nanopore. (mpg 8.5M)The movie shows a rocking view of a nanoprecipitate inside a polymer nanopore. The PET material is shown in gray. PET residues with deprotonated carboxyl groups are shown in licorice representation. The nanoprecipitate is shown as a blue surface. |
 |
Movie 4. Nanoprecipitation due to Ca2+ and HPO42- ions. (mpg 5M)The movie shows calcium phosphate precipitation in nanopores using Ca2+ and HPO42- ions, colored in green and red, respectively. Deprotonated PET carboxyl groups are shown as purple lines. K+ ions, Cl- ions, PET bulk material and water molecules are not shown. |
 |
Movie 5. Nanoprecipitation due to Ca2+ and H2PO4- ions. (mpg 5M)The movie shows calcium phosphate precipitation in nanopores using Ca2+ and H2PO4- ions, colored in green and blue, respectively. Deprotonated PET carboxyl groups are shown as purple lines. K+ ions, Cl- ions, PET bulk material and water molecules are not shown. |
 |
Movie 6. Nanoprecipitation due to Ca2+, HPO42-, and H2PO4-ions. (mpg 3.5M)The movie shows calcium phosphate precipitation in nanopores using Ca2+, HPO42-, H2PO4- ions, colored in green, red, and blue, respectively. Deprotonated PET carboxyl groups are shown as purple lines. K+ ions, Cl- ions, PET bulk material and water molecules are not shown. |
 |
Movie 7. Control simulation for nanoprecipitation. (mpg 3.5M)The movie shows a control simulation without Ca2+ ions. Precipitation is not observed. HPO42- ions are colored in red. Deprotonated PET carboxyl groups are shown as purple lines. K+ ions, Cl- ions, PET bulk material and water molecules are not shown. |
 |
Movie 8. Partial reprotonation for nanoprecipitation. (mpg 3.5M)The movie shows a MD simulation probing reprotonation mechanism. The PET carboxyl groups that are either in direct contact or within 1 nm distance from the nanoprecipitate are reprotonated. As the carboxyl groups are reprotonated, the nanoprecipitate moves out of the pore. Ca2+ and HPO42- ions are colored in green and red, respectively. Deprotonated carboxyl groups are shown as purple lines. Reprotonated carboxyl groups are shown in blue, cyan and yellow, respectively. K+ ions, Cl- ions, PET bulk material and water molecules are not shown. |
 |
Movie 9. Total reprotonation for nanoprecipitation. (mpg 3.5M)The movie shows a MD simulation probing reprotonation mechanism. All carboxyl groups in the nanopore surface are reprotonated and shown in cyan color. Ca2+ and HPO42- ions are colored in green and red, respectively. K+ ions, Cl- ions, PET bulk material and water molecules are not shown. |
Publications
Structures
Atomic structures for PET monomers, PET 9-mers, PET bulk, PET nanopores, as well as topology and pa rameter files needed to perform MD simulations can be found here.Investigators
Related TCB Group Projects
Page created and maintained by Eduardo R. Cruz-Chu.


