Kinase Sensor
Overview
Detection of chemically active molecules remains a challenge for biomedical applications. Ideally, current miniaturization technology should allow manufacturing very small devices, nanodevices, to detect enzyme activity. Indeed, a long-awaited breakthrough would be the advent of kinase profiling microarrays. Protein kinases are known to regulate the majority of biochemical pathways in the cell, controlling a variety of functions such as cell growth, differentiation and mobility. The main function of kinases is to activate other proteins by phosphorylation; that is, to transfer a phosphate group (PO4) from ATP to a sidechain, usually a serine, threonine, or tyrosine. Disruptions of kinase signaling pathways are frequent causes for diseases, such as cancer and diabetes. Therefore, a sensitive tool to accurately detect phosphorylation is of central importance for biomedical research.
Current assays require highly specialized instrumentation or large amount of sample. We believe those issues can be solved by developing a nanodevice capable of directly measuring phosphorylation occurring on peptide probes. In our publication, we propose a new tool for detecting phosphorylation of small unfolded peptides. Our sensor is based on an existing electrophoresis kinase assay from Caliper Life Sciences, which is schematically presented in Figure 1. In the original Caliper device, peptides are capped with a fluorescence marker, the peptide sequence chosen to be recognized by kinases. Peptides and kinases are mixed in a common chamber, where peptide phosphorylation occurs. After that, phosphorylated peptides become negatively charged (Figure 1.a) and can be voltage-driven through an electrophoretic chamber, where they are detected by fluorescence spectroscopy (Figure 1.b).
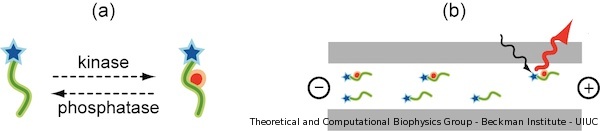 |
Figure 1. Schematic illustration of Caliper Life Science kinase sensor. (a) A single peptide is represented as a green line. After phosphorylation by protein kinase, a tyrosine residue becomes negatively charged. The phosphorylated tyrosine is pictured as red dot. Rhodamine fluorescence probe is drawn as a blue star. (b) Once phosphorylated, the peptides are voltage-driven through an electrophoretic chamber and detected at one end. |
In our sensor, the peptides are covalently attached to a gold chip, immobilizing one end of the peptide to the metallic surface, while the other peptide end is bound to a marker molecule. A schematic description of the device is presented in Figure 2. The functionality of the device relies on registering different spectroscopic signatures for non-phosphorylated and phosphorylated peptides under an external electric field. The intensity of the spectroscopic signal varies according to the stretching or coiling of the peptides. When a voltage bias is applied orthogonal to the surface, non-phosphorylated peptides should emit a characteristic signal which is insensitive to the changes in voltage (Figure 2.b). Conversely, phosphorylated peptides, due to their extra negative charges, are sensitive to the voltage bias and change conformation, either increasing or decreasing the spectroscopic signal (Figure 2.c).
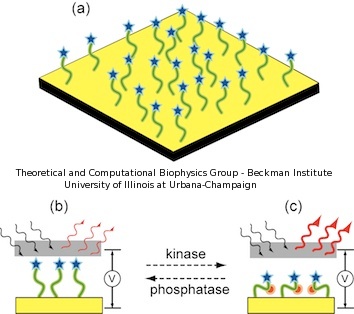 |
Figure 2. Schematic illustration of novel kinase sensor. (a) The peptide nanoprobes are immobilized on a nanostructured gold surface. (b) When peptides are non-phosphorylated, the spectroscopic signal is unaffected by an applied electric field. (c) When peptides are phosphorylated, the negative charges bend the peptides depending on the voltage polarity, enhancing the spectroscopic signal. |
The current work presents a proof of concept, namely that phosphorylated and non-phosphorylated peptides bound to a gold chip produce different signals under different voltage polarities. As expected, our results also open new questions. In this regard, molecular dynamics simulations become critical to imagine the intermolecular interactions in nanodevices and propose alternatives from the initial design.
Experimental Setup and Atomic Model
As mentioned above, we present a sensor that detects phosphorylation of small peptides. The sensor is composed of short peptides of dozen aminoacid length, tethered onto a nanoconic metallic surface. Figure 3 shows the experimental device. The sensor is built on a silicon wafer, which is covered with a thin layer of gold. The active area of each sensor is a 5x5 square array of 1.5 mm size (Figure 3.a). Each square contains a high density nanocone array (Figure 3.b), needed for enhancing the spectroscopic signal (see Yi Chen's experimental paper for details). A corresponding molecular dynamics (MD) model was built (Figure 3.c) to study the conformational changes ocurring at atomic level.
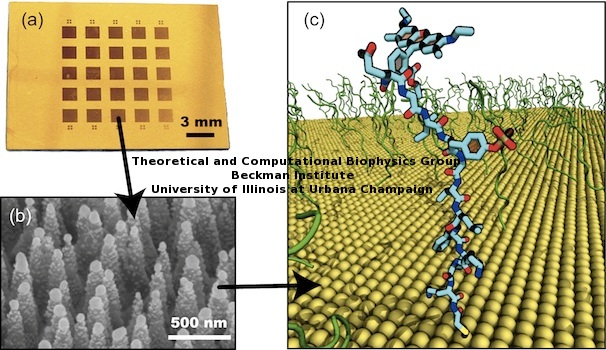 |
Figure 3. Kinase sensor tested in bench and in silico. (a) Optical image of kinase sensor. Each device is a nanotexturized silicon chip with metallic gold coating. (b) Nanostructures at the activated areas of the kinase sensor. The image shows silicon nanocones with uniformly coated gold nanoparticles. Peptides are attached to the gold nanoparticles. (c) The atomic molecular dynamics (MD) model of kinase sensor. Peptide probes are colored in green, metallic surface in yellow. A single peptide is highlighted in licorice representation. |
We employed the same peptide used by Caliper Science: (NH3)-EGIYGVLFKKKC-(COO). It contains a tyrosine at position 4, a target for phosphorylation by kinases. The peptide sequence from positions 1 to 7 (EGIYGVL) is a substrate for Src kinases. The N- terminus is attached to a rhodamine molecule (Rho) to induce a fluorescence response. The C- terminus includes a cysteine, used to attach the peptide to the gold surface.
Sensor Response
Due to the electrostatic coupling effects, the SERS signal is very sensitive to the distance between peptides and gold surface, and a significant SERS variation is expected for even a slight conformational change. The averaged SERS spectra for phosphorylated peptides are shown in Figure 4. The spectra were measured under 0, +1.2V and -1.2V conditions. The SERS signal intensity exhibited a significant change, namely, a higher signal for positive electric field and a lower one for negative electric field. For the non-phosphorylated peptide probe, the SERS signal intensity did not register an observable change under different voltage conditions (see paper).
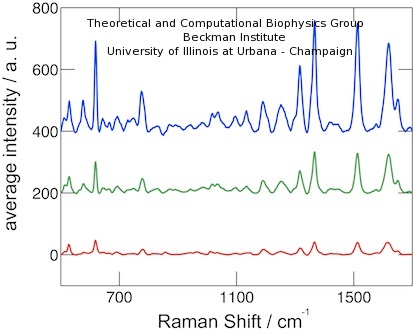 |
Figure 4. SERS spectra of phosphorylated peptide probes under electrical field with opposite polarities. Blue (top), green (middle) and red (bottom) lines show spectra for +1.2 V, 0 V, and -1.2 V, respectively. |
The above results demonstrate that the presence or absence of phosphate groups on peptide probes is easily identified spectroscopically on the metallic nanosurface through SERS. MD simulations were performed to validate the interpretation of SERS signals at atomic resolution. We simulated a system composed of 25 peptides, the peptide sequence being the same as in the experiments. We applied external electric fields and monitored the conformation of the peptides. In order to speed up the response we increased the bias to +60 V and -60 V. The results for phosphorylated peptides are presented in Figure 5.
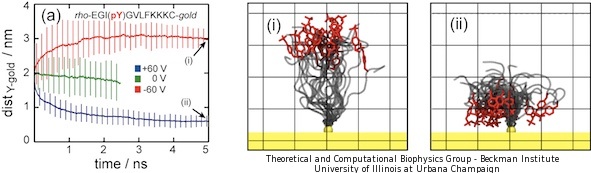 |
Figure 5. Bending of phosphorylated peptides revealed by molecular dynamics simulations. Panels (a) shows the average tyrosine-gold distance for 25 phophorylated peptides under +/- 60V voltage biases. Error bars represent ± standard deviation. Panels (i) and (ii) show snapshots of two peptides after 5 ns for +60 V (i) and -60 V (ii) voltage biases. The peptides are represented as gray tubes. Tyrosine residues are shown in red color. Rhodamine residues are not shown. The 25 peptides were aligned using the attaching gold atom, shown in yellow. Grid length is 1 nm. |
It is evident from Figure 5 that tyrosine-gold distances converged to either complete stretching (-60 V, red line) or complete bending (+60 V, blue line) values. Figures 5.i and 5.ii present snapshots of the final conformation after 5 ns of MD simulations. The negative charge of phosphorylated tyrosine influenced the peptide conformation, inducing stretching for negative voltages (Figure 5.i) and coiling for positive ones (Figure 5.ii). A movie showing dynamic bending and stretching of the phosphorylated peptides is provided below.
Significantly, MD simulations confirmed the experimental results; that is, phosphorylated peptides change their conformations under applied electric field, while non-phosphorylated peptides remain insensitive. Furthermore, our MD simulations revealed possible faults that can halt the sensor performance. Based on the MD results, we propose some changes to improve the device. We propose a modified sequence: EGIYGVLAAAAC, which preserves positions 1 to 7 (EGIYGVL) for kinase recognition, removes rhodamine, and replace lysines with alanines, the later being small residues that do not bind gold. The proposed sequence was tested using MD simulations at ± 60 V. The response was still successful, non-phosphorylated peptides are insensitive to voltage biases, phosphorylated peptides move depending on the voltage polarity (see paper). Such sequence still need to be bench tested for SERS, but if it were successful, it would overcome the caveats detected in the initial design and become a candidate for testing kinase activity.
Movies
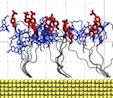 |
Movie 1. Response of phosphorylated peptides to external electric field. (mov 13M)The movie shows two MD simulations of phosphorylated peptide sensors under +60 V (left) and -60 V (right). The peptide sequence is Rho-EGI(pY)GVLFKKC-gold, where pY denotes phosphorylated tyrosine. Protein peptides are shown as a gray transparent tube, Rho residues are shown in blue licorice representation, and phosphorylated tyrosines are shown in red. Both MD simulations were performed for 5 ns. |
Publications
Investigators
- Yi Chen
- Eduardo R. Cruz-Chu
- Jaie C. Woodard
- Manas Gartia
- Klaus Schulten
- Logan Liu
Page created and maintained by Eduardo R. Cruz-Chu.


