Membrane Sculpting by BAR domains
 BAR domains sculpting membranes into tubes. See
 Living cells are characterized by intricately curved internal membranes forming organelles which facilitate cellular processes. Generation of membrane curvature is an essential step in cellular morphogenesis, typically achieved with the help of various proteins that employ different mechanisms to perform this task. One relatively well-studied family of membrane-sculpting proteins are the BAR domains (see Figure 1), which are found in many organisms and drive the formation of tubular and vesicular membrane structures in a variety of cellular processes, including fission of synaptic vesicles, endocytosis, and apoptosis. In vitro, BAR domains sculpt high-curvature membrane tubes and vesicles from initially low-curvature membranes. BAR domains sculpt cellular membranes by acting on the membrane surfaces, producing concave or convex membranes. They achieve this through their own surfaces being complementary shaped in regard to the membrane target shape. Usually, the domains act on negatively charged lipids employing dominantly Coulomb forces.
Very little detail is known about how cells sculpt their membranes. This web page describes results of computational studies that help to answer questions about how cell membrane shapes are generated, learning from the case of the BAR domain proteins.
Four-scale description of membrane sculpting by BAR domains
Studying sculpting of cellular membrane by proteins, such as BAR domains, is an extremely difficult task. For experiments, the system components are too small and disordered, and the process is too fast to be well resolved. For atomistic computer simulations, on the other hand, the systems involved are huge (ten to hundred million atoms), and the time scales of interest are too long (microseconds to milliseconds). The approach described below employs a novel systematic computational study covering the relevant time or length scales.
We have developed and tested models describing interactions of amphiphysin BAR domain (from Drosophila), with a lipid bilayer membrane, at four scales: (i) atomic level (AA), (ii) residue-based coarse graining (RBCG) level with ~10 atoms represented by a CG bead and single-residue resolution, (iii) shape-based coarse graining (SBCG) level with ~150 atoms per CG bead and a group of beads per protein, (iv) a mesoscopic continuum level with the membrane and proteins represented through an elastic membrane model. Each description level is parameterized based on the more detailed description of simple systems.
Single BAR domain simulations
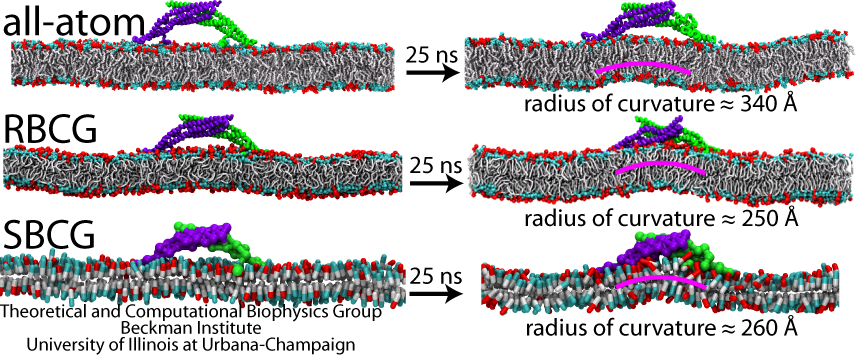
A single BAR domain on a patch of membrane (DOPC mixed with 30% negatively charged DOPS) was observed to induce local curvature in all-atom, RBCG and SBCG simulations. In all cases, a bending mode developed underneath the BAR domain-occupied region of the membrane and stabilized after ~25 ns. The curvature observed in our simulations (AA, RBCG and SBCG) falls in the same range and varies among the simulations. Thus, the RBCG and SBCG models reproduce the process in which a single-BAR domain induces a membrane curvature, with the magnitude and variation of the curvatures, as well as the time scale of curvature generation, agreeing well with characteristics seen in all-atom (AA) simulations.
Simulations of Six-BAR domain systems
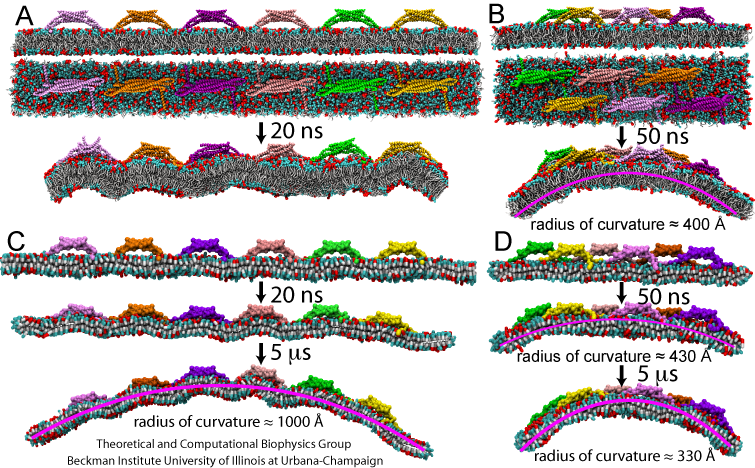
Exploring the RBCG and SBCG method, we investigated how multiple BAR domains generate membrane curvatures. Six BAR domains were placed on an initially planar membrane (Figure 3), in two different arrangements, namely, a non-staggered arrangement, and a staggered arrangement. In the RBCG simulations with the non-staggered arrangement, BAR domains induced a local, but not a global curvature with time scale of tens of nanoseconds (Figure 3A). In the RBCG simulations with the staggered formation, global bending developed, with the radius of curvature reaching ~400 Angstroms within 50 ns (Figure 3B). This radius is comparable to experimentally observed values. The local curvatures observed are close to those in simulations of single BAR domains (Figure 2).
Due to the reduction in the number of particles and the increase of the integration time step in going from the RBCG to the SBCG model, we were able to simulate the dynamics of six BAR domains on a longer time scale, namely, up to 5 microseconds, as shown in Figure 3C and D (see also Movies mpg movie 1, 1.9M and mpg movie 2, 2.0M ). The SBCG simulations reproduce the results of the RBCG simulations over 50 ns ideally, but reaching further in time reveal global curvature arising also in the case of the non-staggered BAR domains arrangement. Up to 100-400 ns, the membrane remains globally flat, but then starts to curve (Figure 3 C). The bending reaches its maximum at 1.5 microseconds, with a radius of global curvature being 1000 Angstroms. In contrast, the membrane in the staggered system reaches the global curvature radius of 300-400 Angstroms during the first 300 ns of simulation, and does not exhibit significant further changes thereafter.
The differences between the curvatures reached and the dynamics of bending between simulations with a single BAR domain, with non-staggered six BAR domains, and staggered six BAR domains indicate that the distribution of BAR domains on the membrane determines the membrane curvature. The observed values of the radius of curvature range from 100-150 Angstroms for local bending produced by individual BAR domains to 1000 Angstroms in the case of global curvature in SBCG simulations. This agrees well with experimental observations that BAR domains may produce membrane tubes with a wide spectrum of curvatures.
EM computations
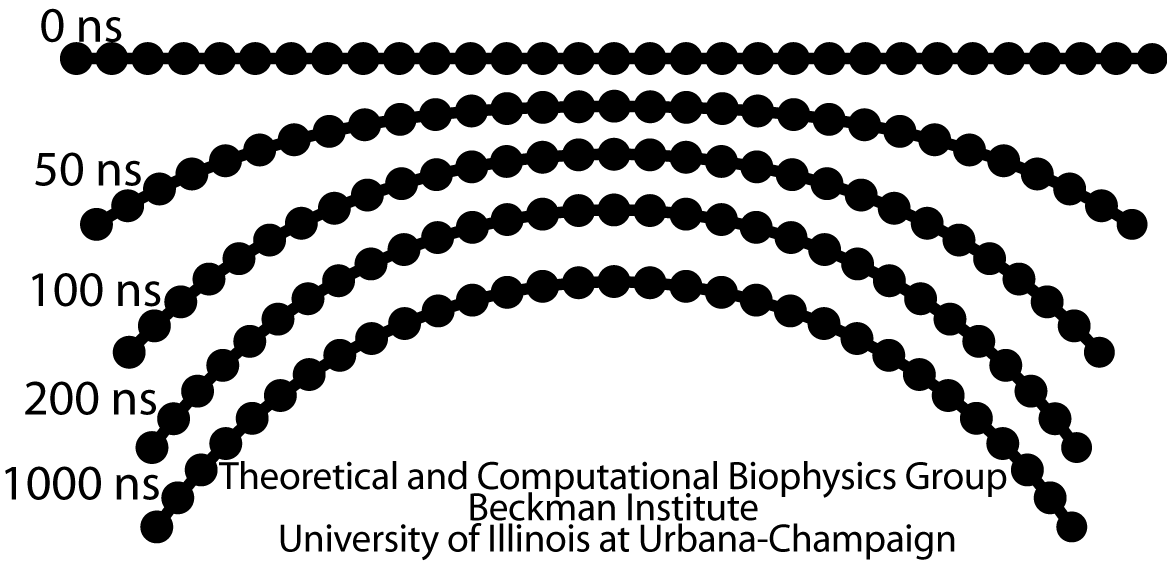
A continuum EM model was parameterized to reproduce the dynamics of the six-BAR domain system with the staggered arrangements of the proteins. Snapshots of the membrane shape are shown in Figure 4 and correspond well to the membrane evolution observed in SBCG simulations. The membrane starts to bend gradually and reaches a radius of ~250-400 Angstroms at ~300 ns, at which point the curvature stabilizes. Overall, the EM model captures very well the membrane curvature dynamics observed in the simulations.
See also a related preview article in journal Science: Large-Scale Molecular Dynamics Simulations of Self-Assembling Systems.
Membrane Tubulation by Lattices of BAR domains
The findings described above have shown that an arrangement of multiple BAR domains on the membrane surface in some sort of a lattice is crucial for global membrane curvature to arise. However, many questions remain open. What is the effect of different lattices on the induced membrane curvature? What are the protein-membrane interactions, as well as interactions between BAR domains within each lattice, that are most important for membrane sculpting? Furthermore, static images of membrane tubes sculpted by BAR domains have been obtained experimentally, however, employing multiple cycles of annealing and freezing. How does the dynamic picture of tube formation looks like at physiological temperature? Computer simulations employing a multiscale strategy presented above enable one to reach the length and time scales necessary to answer these questions.
Effect of different BAR domain lattices on membrane curvature
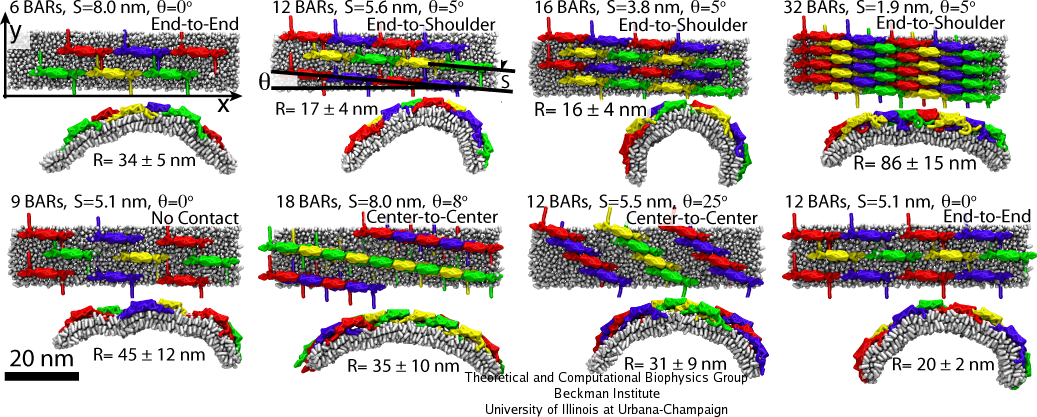
Multiple SBCG simulations have been employed to study many different BAR domain lattices, sampling BAR domain densities from 6 to 35 dimers per 1,000 nm2, various orientations of protein rows within the lattices, and different connections between BAR domains within one row. Fig. 5 shows several examples of the lattices studied. For each lattice type, five independent simulations were performed; the average radius of curvature of the membrane developed in the five simulations are shown in Fig. 5. The highest membrane curvatures observed correspond to radii of 16-20 nm, while the curvature radius of the protein itself is 11 nm. Such strongly bent membranes are produced by lattices with approximately 10-20 dimers per 1,000 nm2.
It is intuitively clear that lattices with low densities of BAR domains should produce low curvature, since the bending force is not high enough. For intermediate densities the bending is efficient, but for densities higher than approximately 20 dimers per 1,000 nm2, the induced membrane curvature again becomes low. This is puzzling, since higher densities should, in principle, lead to stronger bending force. Analysis of the SBCG simulations shows that for dense lattices, interactions between the concave surface of BAR domains and the membrane are occluded by the N-terminal helices and tips from neighboring BAR domains. As a result, scaffolding of the membrane by the BAR domain concave surface cannot proceed, and the membrane bending is inefficient.
Simulations for various lattices (Fig. 5) show that the arrangement of dimers within one row is decisive for the induced curvature. The highest curvature, R = 15-20 nm, is observed when BAR domains are arranged end-to-end or end-to-shoulder, but not center-to-center. All these contacts are stabilized by electrostatic interactions. The end-to-shoulder arrangement appears particularly favorable due to a high concentration of charged residues at the contact point, e.g. Lys161, Arg162, Lys163, Asp164, Asp165, Lys167 at the tip of the BAR domain and Lys15, Arg19, Glu22, Lys30, Asp32, Arg33, Asp36, and Asp146 at the ``shoulder'', most of which are highly conserved.
2.3 million atom, 300 ns all-atom simulation of a BAR domain lattice
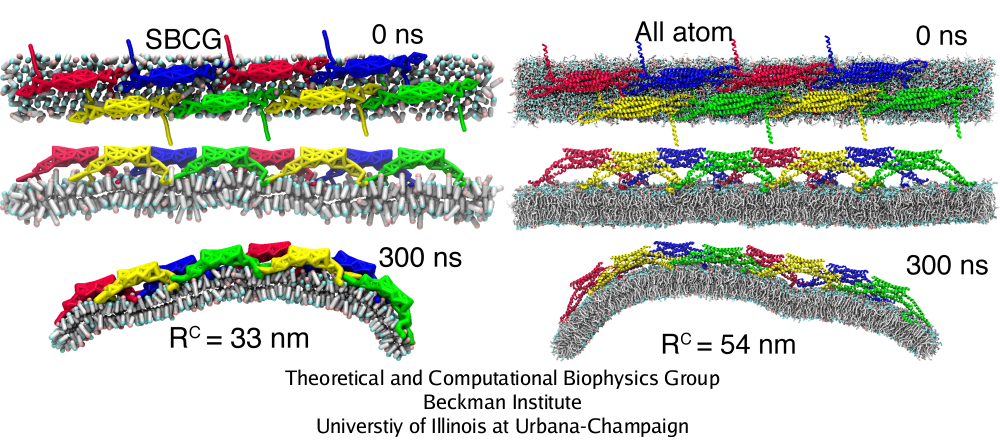
Simulations of BAR domain lattices in Fig. 5 can be mastered presently only through the SBCG approach. However, in one case, we have carried out also a 2.3 million atom, 300 ns all-atom simulation (see also mpg movie 3, 1.3M) to test the SBCG model (Fig. 6). The all-atom simulation, as well as analogous SBCG simulations, show that the assumed BAR domain lattice remains stable and induces global membrane curvature. Membrane bending in the all-atom simulation is slower than in SBCG simulations: at 300 ns, the radius of curvature is R = 54 nm, while for the SBCG simulation of the same lattice this value of R is reached within 80 ns, and at 300 ns one finds in the SBCG case R = 27 nm (averaged over five SBCG simulations). The SBCG simulation shown in Fig. 6 is the one where the curvature arose slower than average, resulting in R = 33 nm at 300 ns. However, values of R are sensitive to slight geometry changes at the membrane edges, so that despite R = 54 nm form the all-atom and R = 33 nm for the SBCG simulation, visually it is clear that the membrane is curved to approximately the same extent. Thus, SBCG results overestimate the speed of membrane bending, but overall the all-atom simulation agrees with the SBCG simulations in regard to general trends of membrane bending and of interactions of BAR domains with the membrane and with each other.
Complete membrane tubulation
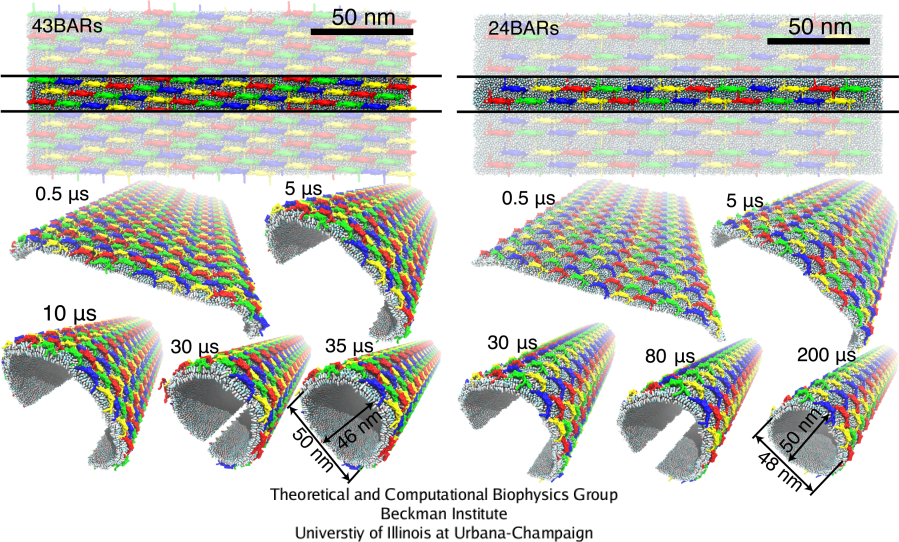
The SBCG simulations were extended to larger systems with the membrane segment 200 nm long, and involving 24 and 43 BAR domain dimers, which permits complete membrane tubulation (Fig. 7). In 8 independent simulations, the membrane was uniformly bent by BAR domains, and in two cases shown in Fig. 7 the membrane edges came close enough during the simulated time to enable fusion. Membrane bending was initiated at the edges of the membrane within a few hundred nanoseconds, and then propagated towards the center, rounding the entire membrane on a time scale of 30-200 &mus. Once edges fuse, a complete, stable tube was formed. Due to the higher BAR domain density, the lattice with 43 BAR domains bends the membrane stronger, completing the tubulation about 6 times faster than the lattice with 24 BAR domains. The following movies show the SBCG trajectories of membrane tubulation: mpg movie 4, 3.0M and mpg movie 5, 5.3M.
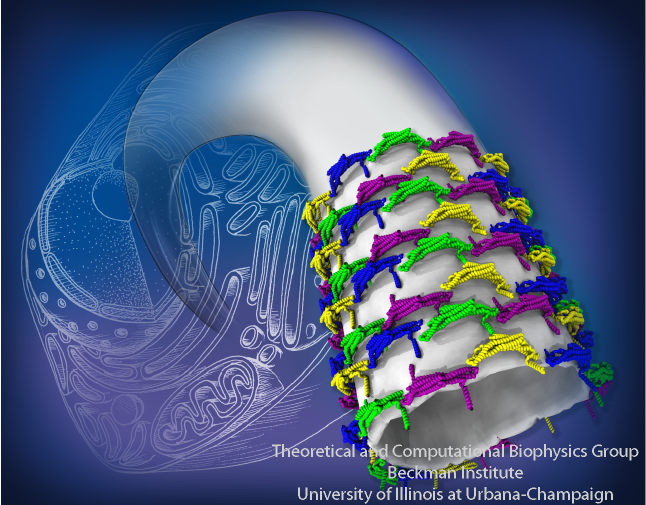
Membrane tubes formed by BAR domains
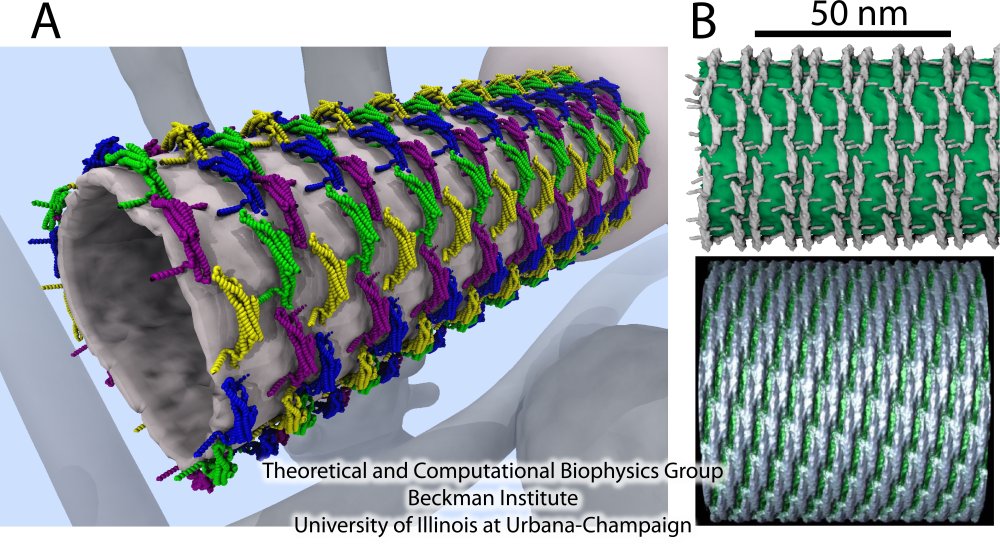
Figure 8A shows the details of the resulting membrane tubes formed by BAR domains (blue, green, yellow and purple). The background shows an artistic representation of the cell interior, where the sculpting occurs: several tubular and vesicular membrane structures are depicted, including a large membrane sack, from which the tube on the foreground grows. In Figure 8B, we present the membrane tubes sculpted by amphiphysin BAR domains observed in our simulations together with the only available experimental high-resolution images of F-BAR domain-induced tubes obtained through cryo-electron microscopy (cryo-EM) (Frost et al., Cell, 132:807 (2008)). A key feature of the simulated lattices is their irregularity. The cryo-EM image of F-BAR domains visualizing highly ordered lattices, were obtained using repeated annealing (Frost et al., Cell, 132:807 (2008)). Without the annealing, tubes form, but the arrangement of BAR domains is too irregular to permit high-resolution cryo-EM reconstruction. The N-BAR domain lattice in our simulations features some order, but locally is irregular; no two dimers have exactly the same orientation. Most likely, naturally occurring, i.e., not annealed, BAR domain lattices resemble the simulated ones. From simulations, we found that BAR domains are quite flexible and maintain a well-connected lattice even if proteins shift significantly. Clearly, these properties allow BAR domain lattices to function efficiently even under conditions of thermal noise and disorder, which are characteristic for living cells.
Publications
Investigators
Related TCB Group Projects
- Intrinsic Curvature Properties of Photosynthetic Proteins in Chromatophores
- Coarse-Grained Molecular Dynamics
Page created and maintained by Anton Arkhipov and Ying Yin.


