VMD Signal Processing Plugin Package, Version 1.1
Background and Scope
The signalproc plugin is a collection of scripted and compiled Tcl plugins that can be of use for "signal processing" and related types of applications within VMD. To load all packages of this collection in one go you can use:
package require signalproc
specden - Calculation of Spectral Densities (v1.1).
This plugin is the heart of the IRSpecGUI tool. It allows to compute spectral densities from trajectories using time series data. By computing the Fourier transformed auto-correlated data directly. This method has the advantage over the more traditional way of first computing an auto-correlation function (ACF) and then performing the fourier transform, that it is frequently faster (O (N log(N)) instead of O(N^2)), especially if only lower frequency information is required, and doesn't require to cut off the intermediate ACF arbitrarily. On top of that i can renormalize the resulting power spectrum with frequency dependent prefactors based on a number of different models.
Unlike the GUI using the low level specden command direcly, allows to process for much more flexible auto-correlation data calculations. Below are a few example application scripts.
Syntax
The specden command is individually added to the Tcl script interpreter through:
package require specden
And used as specden <x-,y-,z-data> <deta t> <max. freq> ?<norm>? ?<temp>? ?<oversamp>? for example like this:
specden $dat 10.0 3000.0 harmonic 300.0
The individual arguments are:
| <x-,y-,z-data> | This is a list of lists of xyx-triples, which can be any data like dipole moment vectors, velocities, positions, etc. for one-, or two-dimensional data sets, the missing entries can be padded with zeroes. |
| <delta t> | Real time between the individual data sets in atomic units (1 a.u. ~= 0.0242 fs, 1ps ~= 41341.4 a.u.). |
| <max. freq> | Largest frequency to be considered in the calculation in wavenumbers (cm^-1). The maximum allowed value depends on the size of the data set. Using a smaller number, if no high frequency components are required, will speed up the calculation. |
| <norm> | Renormalization/Correction method of the spectral density. Optional. fourier: is the plain power spectrum of the input data (normalized to unity in the output frequency range; classical: is the power spectrum with a prefactor of \omega ( 1 - \exp(-\beta \hbar \omega) ) corresponding to the classical/Gordon limit; kubo: is the power spectrum with a prefactor of \omega \tanh(\beta \hbar \omega/2) corresponding to the Kubo correction; harmonic: is the power spectrum with a prefactor of \omega \beta \hbar \omega corresponding to the high temperature / harmonic limit (this is the recommended correction factor); schofield: is the power spectrum with a prefactor of \omega ( 1 - \exp(-\beta \hbar \omega) ) \exp(\beta \hbar \omega /2) corresponding to Schofield's correction. (Default: harmonic). |
| <temp> | Temperature of the system in Kelvin. Needed for the corrections from above.
Optional. (Default: 300.0) |
| <oversamp> | Integer that determines the noisyness and resolution of the resulting spectrum through oversampling. Optional. A value of 1 gives maximal resolution and noise. Larger values reduce noice corresponding to a square root law at the expense of resolution. |
sgsmooth - Savitzky-Golay Data Smoothing and Numerical Derivative Calculation (v1.1)
The Savitzky-Golay method performs some kind of improved slinding window averaging filter by what comes down to effectively a local polynomial regression (of degree k) on a distribution of points. In a variant of this filter, the polynomial can be used to perform a calculation of a numerical derivative.
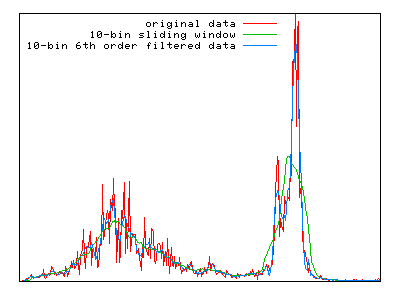
The main advantage of this approach is, that with a proper choice of parameters, it tends to preserve features of the original data distribution such as relative maxima, minima, width and the integral, which are usually 'flattened' by other adjacent averaging techniques (like sliding window averages, for example). Very good results are achieved with already quite low order polynomial (4th-8th) and moderate window sizes. See graph on the right for an example. Note that the actual window size is twice the number of polynomial bins plus one, i.e. 21 in the example.
Syntax
The sgsmooth and sgsderiv commands are individually added to the Tcl script interpreter through:
package require sgsmooth
And used as sgsmooth <data> <window> <order> and
sgsderiv <data> <window> <order>.
The individual arguments in both cases are:
| <data> | This is a list floating point numbers. The data points are assumed to be equidistant. |
| <window> | This is the sliding average window size parameter. The total number of data points used to generated the smoothed number is twice the window size plus one. |
| <order> | This is the order of the polynomial that is being used to generate the windowing function. |
sgsmooth will return a smoothed version of the list of data points that have been given as input, sgsderiv its first derivative.
Reference:
A. Savitzky and Marcel J.E. Golay,
Smoothing and Differentiation of Data by Simplified Least Squares Procedures.
Analytical Chemistry, 36: 1627-1639. (1964)
doi:10.1021/ac60214a047
fftpack - 1d, 2d, 3d, and 4d Fast Fourier Transforms (v1.1)
This plugin provides a Tcl script interface to one and multi-dimensional Fourier transforms adapted from the Kiss FFT package, a small, portable and fairly efficient FFT library with a BSD type license. This package can be used to do Fourier analysis or synthesis on data and other convolutions or filtering of data sets. The code provides complex to complex transforms for one to four dimensional data. For 1d data sets also complex-to-real and real-to-complex transforms are supported.
Syntax
The the fftpack commands are individually added to the Tcl script interpreter through:
package require fftpack
The take lists of numbers as arguments and return the fourier transformed data.
Complex numbers are represented as list of two read numbers. If a command expects
a list of complex numbers, but only a list of real is given, the missing imaginary
part will automatically be added.
The individual transform commands are:
| r2cfft_1d | Real to complex 1d Fourier transform. |
| c2rfft_1d | Complex to real 1d Fourier transform. |
| cfftf_1d | Complex to Complex forward 1d Fourier transform. |
| cfftb_1d | Complex to Complex backward 1d Fourier transform. |
| cfftf_2d | Complex to Complex forward 2d Fourier transform. |
| cfftb_2d | Complex to Complex backward 2d Fourier transform. |
| cfftf_3d | Complex to Complex forward 3d Fourier transform. |
| cfftb_3d | Complex to Complex backward 3d Fourier transform. |
| cfftf_4d | Complex to Complex forward 4d Fourier transform. |
| cfftb_4d | Complex to Complex backward 4d Fourier transform. |
data_io_lib - Frequently Used Operations on 1d-, 2d-, and 3d-data (v1.1)
Some utility Tcl scripts for reading, writing and manipulating data sets related but not limited to the task of signal processing in Tcl. All commands are placed in the ::DataIOLib:: namespace.
| transp_list_of_lists <list> | Take a list with m elements of n-item lists and transpose it, so you have n elements of m items each. |
| gen_lin_list <start> <delta> <num> | Generate a sequence of num numbers with a linearly increasing value. |
| write_list <name> <list> [<title>] | Write a list to a text file name suitable for plotting data with Gnuplot or XmGrace. If list is a list of lists, then the resulting file will have multiple columns. |
| read_list <name> [<column>] | Read a list from a text file name. The optional column parameter defaults to 0 (= the first column). It can be set to 'all' to read all columns. Comment lines starting with '#' will be skipped. |
| write_2d_list <name> <list> [<title>] | Write a list of lists to a text file name in a three column 'i', 'j', 'data' format as it is used by Gnuplot for the "splot" command by default. |
| write_3d_list_real <name> <list> [<title>] | Write a 3-d list of lists of lists data set to a text file name in DX-like format. If the innermost level has complex numbers, i.e. lists with 2 elements, only the real part is used. |
| write_3d_list_image <name> <list> [<title>] | Write a 3-d list of lists of lists data set to a text file name in DX-like format. The innermost level is expected to have complex numbers, i.e. lists with 2 elements, only the imaginary (= second) part is used. |
Examples
Spectral Densities Plugin Examples
Example 1: data from external file
We assume the data file has its information in columns (here: CPMD style ENERGIES files) and we want to compute the power spectrum of column two for a pair of files and plot them using the multiplot plugin to compare them.
    # compare effect of fictitious mass on fictitious vibronic DOS in CP dynamics
    package require specden
    package require multiplot

    set fp [open "ENERGIES-cp-200au" "r"]
    set dlist {}
    while { [gets $fp dat] >= 0 } {
        lappend dlist [list [lindex $dat 1] 0.0 0.0]
    }
    close $fp
    lassign [specden $dlist 4.0 20000.0] flist slist
    set ph [multiplot -x $flist -y $slist -title "EKINC Power Spectrum" -lines -linewidth 3 -marker points -plot]

    set fp [open "ENERGIES-cp-400au" "r"]
    set dlist {}
    while { [gets $fp dat] >= 0 } {
        lappend dlist [list [lindex $dat 1] 0.0 0.0]
    }
    lassign [specden $dlist 4.0 20000.0] flist slist
    close $fp
    $ph add $flist $slist -lines -linecolor red -linewidth 3 -plot
Example 2: Position auto-correlation
We want to compute the power spectrum of all H labeled atoms from a position auto-correlation function (works the same way for velocity auto-correlation functions, if your trajectory file contains velocities instead of positions). This example works in text mode and the output is a file with the individual spectra as columns and an averaged spectrum as the last column.
    # calculate power spectrum from position auto-correlation of hydrogen atoms
    package require specden

    set mol [mol new {h2o.psf} waitfor all]
    mol addfile {TRAJEC-cp-200.xyz} waitfor all

    set sel [atomselect $mol {name H}]
    set nf [molinfo $mol get numframes]
    set na [$sel num]

    set reslist {}
    for {set a 0} {$a < $na} {incr a} {
        set dlist {}
        for {set f 0} {$f < $nf} {incr f} {
            $sel frame $f
            lappend dlist [lindex [$sel get {x y z}] $a]
        }
        lassign [specden $dlist 400.0 3000.0 harm 330.0 1] flist slist
        lappend reslist $slist
    }

    # write out the result as: fequency, h1, h2, ...,
    set fp [open "posacfspec-h.dat" "w"]
    set ns [llength $flist]
    for {set i 0} {$i < $ns} {incr i} {
        puts -nonewline $fp "[lindex $flist $i] "
        set avg 0.0
        for {set a 0} {$a < $na} {incr a} {
            set val [lindex $reslist $a $i]
            puts -nonewline $fp "$val "
            set avg [expr {$avg + $val}]
        }
        puts $fp "[expr $avg / $na]"
    }
    close $fp
Parallelization
If compiled from source, specden, sgsmooth, and fftpack can all be compiled with multi-threading support via the OpenMP parallel programming interface. The number of threads can then be controlled by either the usual OMP_NUM_THREADS environment variable, or using the VMD internal VMDFORCECPUCOUNT environment variable. The latter will overrided the former. Note: Due to portability issues, the precompiled VMD binaries shipped from the VMD homepage, are currently (Version 1.8.7) not compiled with OpenMP support.
Authors
These packages are written and maintained by Axel Kohlmeyer with the following contributions:
specden is based on a Fortran 90 code written by Dr. Harald Forbert, and Dr. Volker Kleinschmidt between 2002 and 2004 at the Ruhr-Universität Bochum.
fftpack uses code from Kiss FFT Copyright (c) 2003-2008, Mark Borgerding.


