Selecting atoms by voxel values in VMD
Starting with version 1.8.4, VMD has had the ability to select atoms not
only their own properties, but also by the values of corresponding
voxels in loaded potential, occupancy, and density maps. This feature
can be used to select structural elements that correspond to regions of
interest in a loaded volumetric dataset.
First, you'll need to download and unpack these tutorial example files, which were produced using SITUS, for loading into VMD. (VMD 1.8.5 required)
If you would like to see the end result immediately, you can load the example into VMD, with "vmd -e groelselbyvox.vmd" at the command, or by using the "cd" command in the VMD text console to change to the working directory containing the example files, and then using the "File -- Load State" menu item in the graphical interface to load the groelselbyvox.vmd saved state.
The basic process for selecting atoms by nearest-voxel density values contained in density, occupancy, potential or other volumetric maps is as follows:
- Load the atomic structure into a molecule in VMD.
- Display the structure with your favorite representation.
- Add the density grid (or other volumetric data you wish to select and color the structure with) into the SAME molecule. (e.g. 'mol addfile groel_diff_80.situs')
- Once both the structure and density map are loaded into the same molecule, the next step is to create a new representation ('VDW' is frequently a good choice to start out with).
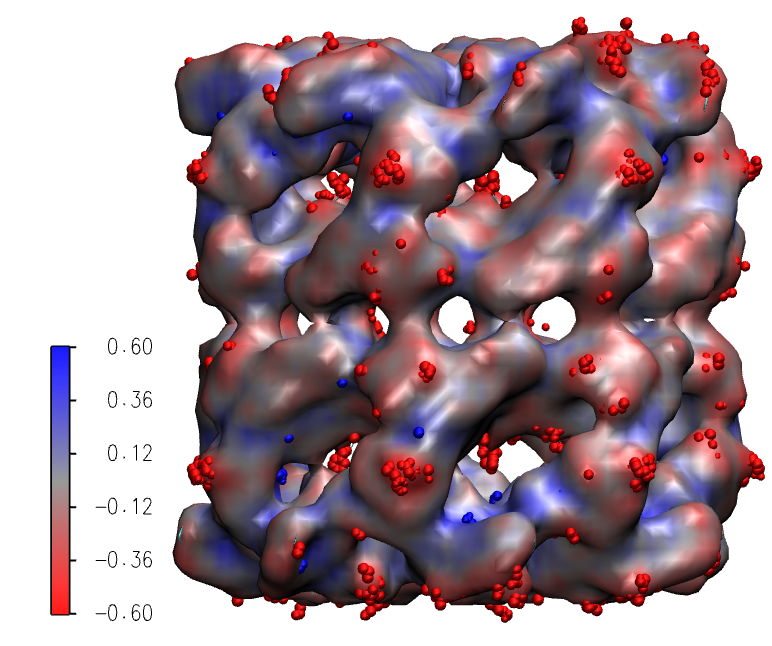
- Once the new VDW representation is created, change the atom selection to something like "volX > 0.6" where X is the index of the volumetric dataset you wish to use for selection, and the scalar value is the threshold of interest. The example file includes two separate VDW representations, one for positive density differences greater than 0.6, and another for negative density differences, lower than -0.6, each set with a manually selected color.
- You can combine multiple selections of this type from several volumetric maps with selections such as "(vol1 > 0.6) and (vol3 > 0.5)".
- When working with low-resolution maps, it may be desirable to use interpolated voxel density values rather than the nearest density voxel value, this is done by selecting with the "interpvol" keyword, e.g. "interpvol1 > 0.5".
- Extra credit is given for adding a color scale bar using the color scale bar visualization plugin. ;-)


