The Molecular Basis of Fibrin Clot Elasticity
Blood Clots and Cardiovascular Diseases
 e
clots must be bot
e
clots must be bot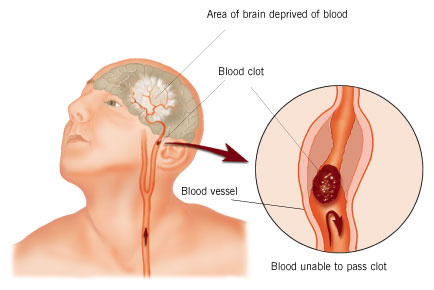
 h
elastic enough to resist the sheering
forces of blood but also stiff enough to not rupture before the
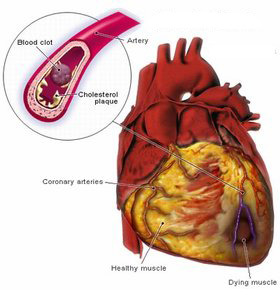
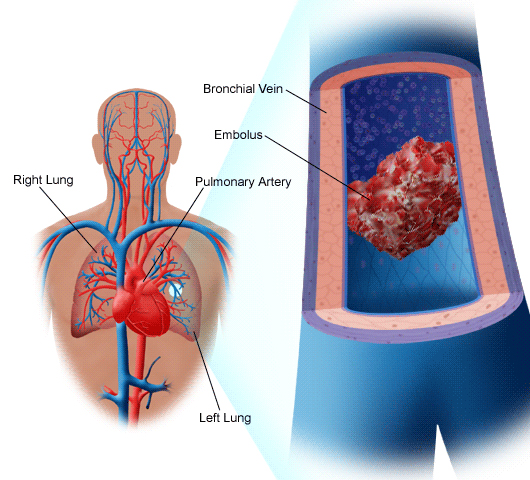
underlying tissue has healed. Sometimes blood clots form in the
wrong location, such as
within a vital blood vessel, and block blood
flow to important organs. For example, a blood clot forming in
the coronary vessels that feed the muscles of the heart leads to a
heart attack. If a clot forms in the lungs or a major vessel in
the brain, these lead to pulmonary embolism and stroke (images courtesy
Medicinenet.com, Hariton & D'Angelo, and Seniorark.com).
Together,
these conditions comprise a class called "thromboembolic disease"
which is literally defined as a piece of a blood clot
(the thrombus) blocking flow in a vessel (embolism),
and represents the
leading cause of death in industrialized nations. Current
strategies for dealing with this disease involve measures to prevent
the clots from forming; however, there has been little
research focus
aimed at preventing blood clots from rupturing once they have already
formed. Here below we present a study which addresses this
issue.
h
elastic enough to resist the sheering
forces of blood but also stiff enough to not rupture before the
underlying tissue has healed. Sometimes blood clots form in the
wrong location, such as
within a vital blood vessel, and block blood
flow to important organs. For example, a blood clot forming in
the coronary vessels that feed the muscles of the heart leads to a
heart attack. If a clot forms in the lungs or a major vessel in
the brain, these lead to pulmonary embolism and stroke (images courtesy
Medicinenet.com, Hariton & D'Angelo, and Seniorark.com).
Together,
these conditions comprise a class called "thromboembolic disease"
which is literally defined as a piece of a blood clot
(the thrombus) blocking flow in a vessel (embolism),
and represents the
leading cause of death in industrialized nations. Current
strategies for dealing with this disease involve measures to prevent
the clots from forming; however, there has been little
research focus
aimed at preventing blood clots from rupturing once they have already
formed. Here below we present a study which addresses this
issue.
Structural Features of Blood Clots
The process of blood clotting starts when
fibrinogen, an abundant plasma protein, is activated by thrombin to
form fibrin fibers. These fibers, together with entrapped red blood
cells and platelets, form a thrombus, or blood clot. This thrombus is
subjected to large shear forces in blood vessels, on the order of
several hundred picoNewtons (pN) . How the clot is able to withstand
these forces determines whether it prevents hemorrhage or ruptures
resulting in thromboembolism. In order to withstand the shear forces
and yet maintain its integrity, a clot must exhibit a measure of
elasticity such that it is able to deform reversibly. Laser
tweezer and
atomic force microscopy (AFM) have been used to stretch individual
fibrin fibers, which have demonstrated considerable elasticity,
reversibly stretching to nearly 2 to 3 times their resting
length. However, the molecular basis of this elasticity is still
unknown.
Other so-called `mechanical proteins' exhibit
intermediate conformations during unfolding as a means to
buffer shear
forces. Based on the observed elasticity of fibrin clots, we
hypothesize that such intermediate elastic conformations exist in blood
clot components and serve as shock absorbers to shield the clot from
the brunt of shear forces. The building block of blood clots is
fibrinogen, a bi-symmetric heterohexameric molecule that is composed of
two peripheral (C-terminal) D regions connected to a central
(N-terminal) E region by two regions of two, three, and four-stranded
coiled α-helices (Figures 1A, B, and C). When
stretched, force
buffering `intermediates'
may arise from these coiled-coil regions. For example, AFM studies
stretching the myosin coiled-coil, leucine zipper coiled-coils, DNA,
and desmin intermediate filaments showed triphasic `signature'
force-extension curves, suggesting that such curves typify
molecules with coiled-coil helical structures. AFM in force
spectroscopy mode can therefore be used to probe the mechanical
characteristics of fibrinogen's coiled-coils. However,
interpretation of force spectroscopy experiments of multi-domain
proteins like fibrinogen becomes difficult because of the inability to
assign force extension signatures to any one region of the
molecule. In a bid to reduce ambiguity in AFM force
spectroscopy experiments, steered molecular dynamics (SMD) simulations
were carried out to stretch the fibrinogen molecule and provide a view
of the single molecule's response in atomic level detail.
Comparing simulated and measured force-extension curves permits one to
interpret unfolding events in AFM force-extension curves in terms of a
protein's architectural elements. By comparing AFM experiments
and SMD simulations, we could indeed identify the signatures to
fibrinogen's force-extension curves common to both approaches and,
thereby, verify that the AFM measurements yielded single fibrinogen
characteristics. We could also relate the AFM signatures to
specific molecular transitions of fibrinogen and fibrin protofibrils.
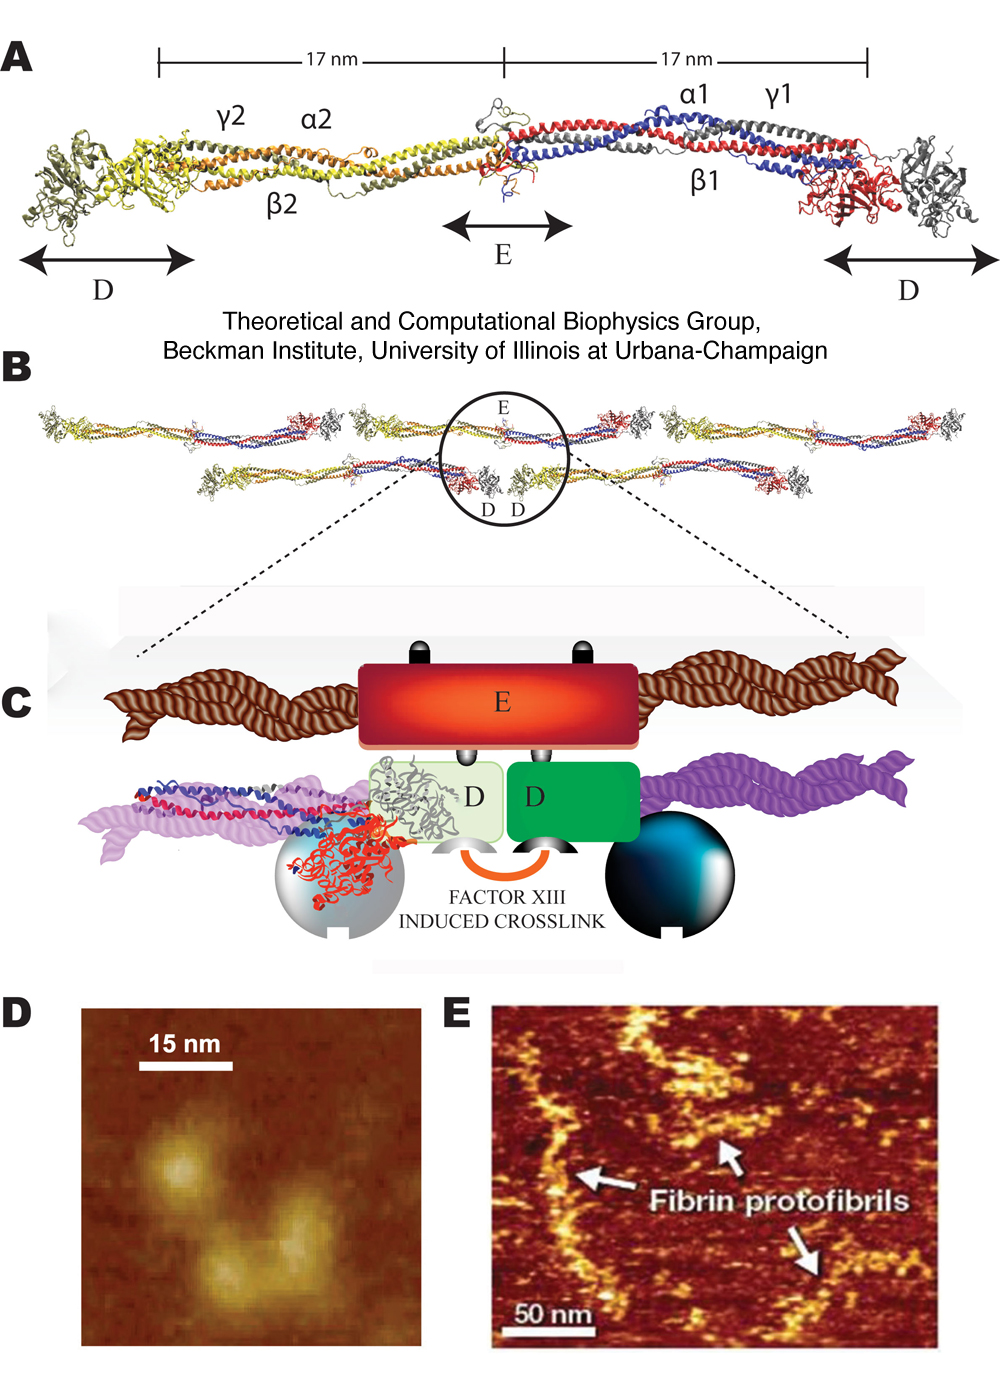
Figure 1. Fibrinogen
structure and AFM imaging. (A) Crystal structure of fibrinogen
(1m1j) showing the central E region connected to the distal D regions
by two sets of three-stranded coiled-coils. Schematic diagram of
a fibrin protofibril showing (B) the half staggered double stranded
configuration and (C) trimodular interactions between the central E and
distal D regions, with crosslinking between the D regions
involving factor XIII. Liquid tapping mode AFM images of single
fibrinogen molecules showing the expected trinodular structure (D) and
fibrin protofibrils showing linear strands of 7-10 fibrin monomers that
are about (250 ± 75 nm n=35) long (E).
AFM Imaging of Fibrin Protofibrils
AFM spectroscopy was performed on single
fibrinogen molecules (Figure 1D) and fibrin protofibrils (Figure
1E). AFM images (obtained in liquid) of single fibrinogen
molecules showed the well known trinodular shape, with distinct D and E
regions visible. Imaging of fibrin protofibrils revealed linear strands
of 7-10 fibrin monomers that are about 250 ± 75 nm (n=35) long
(Figure 1E). The high resolution obtained in liquid allows the
molecular packing of the fibrin monomers within the protofibril to be
discerned. The purity of fibrinogen in solution used for AFM was
verified with SDS-PAGE (see Figure S1 in Supplementary Materials), thus
yielding confidence about the nature of the protein being stretched in
the force spectroscopy experiments.
AFM Force Spectroscopy
Pulling single fibrinogen molecules (Figure 2A)
at physiological pH of 7.4 and [Ca2+] of 2.5mM (as used during imaging)
produced force extension curves characterized by three phases (Figure
2B). The first phase corresponds to straightening of fibrinogen
from its relaxed conformation. This phase, labeled `R', is
characterized by a `rise' in the force measured by the AFM over a 5-15
nm extension. The second phase, labeled `P', is a `plateau' in
the force-extension curve in which the molecule extends by 15 nm at a
constant force of 60 pN. The third phase, labeled `E', is
characterized by an `exponential' rise of the applied force with
further increased extension. At the beginning of the E phase,
immediately following the P phase, there arises a transient decrease in
force measured, producing a characteristic `dip' in the force-extension
curve. Figure 3 shows an overlay of multiple AFM force extension
curves for both single fibrinogen molecules and fibrin protofibrils,
along with overlays of the RPE triphasic curves demonstrating
consistency of plateau length and height as well as the presence of the
`dip' across multiple trials.
Distributions of plateau forces and lengths for single fibrinogen
stretching are shown in Figure 2C and D based on a corresponding
analysis of the R and P phases. A similar analysis relating
coiled-coil extension and associated R and P phases had been carried
out for myosin stretching (Root et al., 2006). The two coiled-coil
regions in fibrinogen are each 111 residues long, which corresponds to
a length of 111 x 0.15 nm (rise per residue along a straight α-helix)
= 17 nm. On the other hand, the length of the completely
unfolded coiled-coil is 111 x 0.36 nm (length per residue of a
completely unfolded polypeptide) = 40 nm. This suggests an
estimated extension of 40 nm - 17 nm = 23 nm upon stretching each set
of coiled-coils to their maximum length, or a 46 nm extension for the
two sets of coiled-coils in fibrinogen. In fact, two triphasic
"RPE" responses are seen while stretching single fibrinogen (Figure
2B), each with a plateau length of approximately 15 nm (Figure
2D). The plateaus in the force-extension curve reflect the
stretching of one (out of two) of fibrinogen's coiled-coils. The
discrepancy between the measured extension (15 nm) and the maximal
extension (23 nm) is likely due to the pick-up point of the AFM tip not
coinciding with the protein terminus.
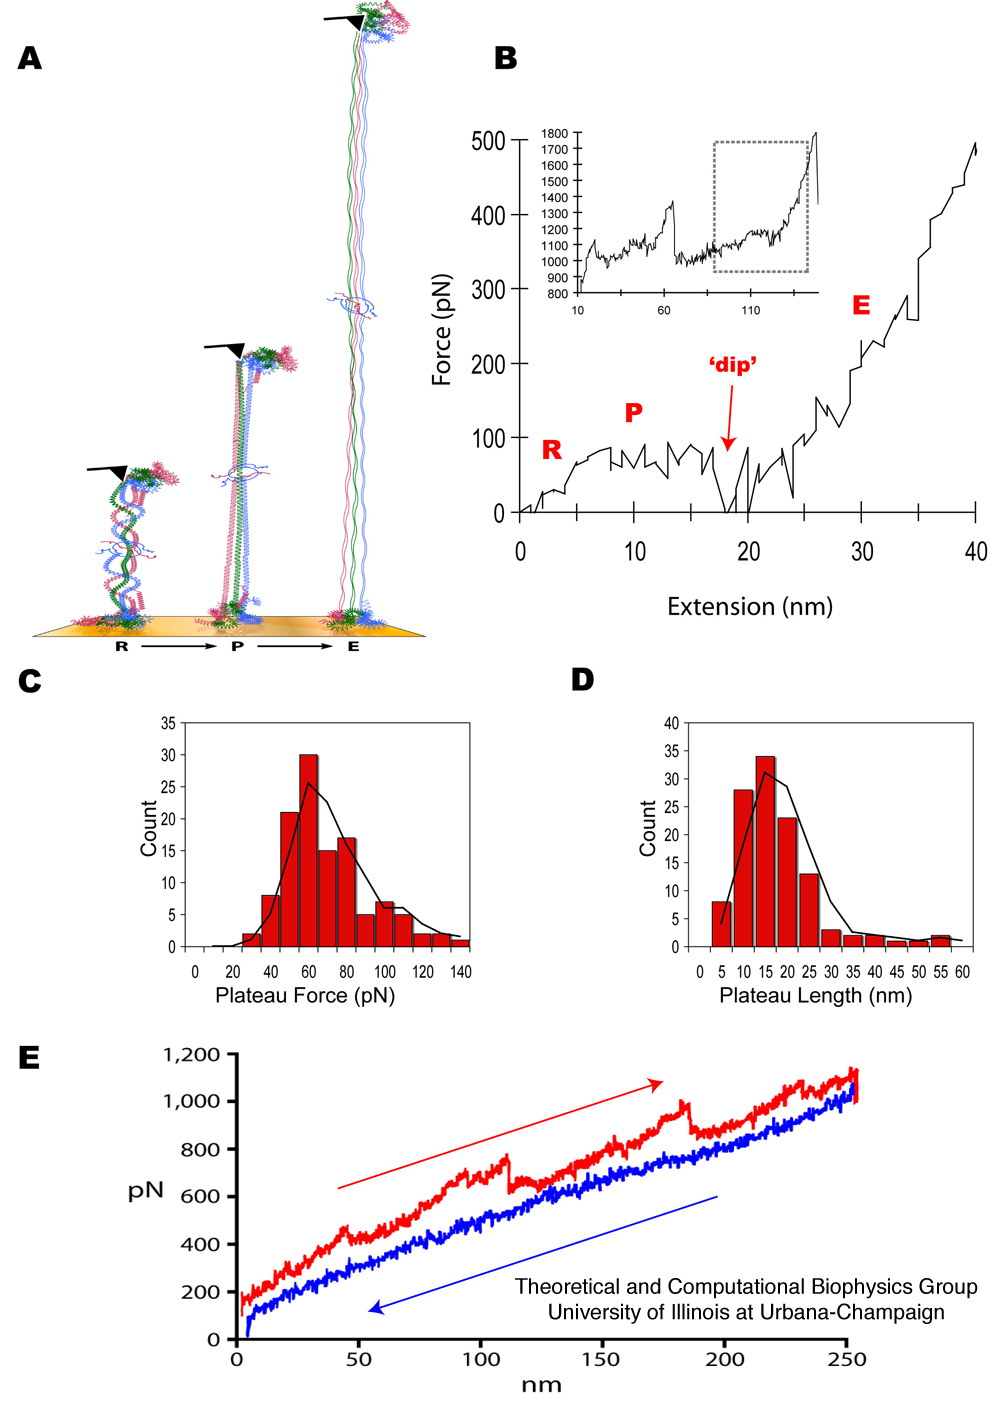
Figure 2. Geometry of
AFM measurement, with fibrinogen and fibrin force-extension curves and
histograms. (A) Diagram illustrating the geometry of the AFM
pulling fibrinogen. Initially, the molecule is straightened from its
relaxed conformation (R phase). This is followed by an extension of the
coiled-coil region during a P (plateau) phase, ending with a `dip' in
the force. Finally, further extension is characterized by an E
(exponential) phase reflecting a steep rise in the needed force.
(B) Force extension curve for stretching a single fibrinogen molecule,
showing the R, P and E phases. The inset shows the complete force
extension curve obtained for a single fibrinogen molecule depicting two
consecutive triphasic signatures, each presumably corresponding to the
unfolding of one of the coiled-coils in fibrinogen (see Figure 1A). The
rectangle denotes the highlighted region. The expanded figure shows a
plateau height of 60 pN and a plateau length of 15 nm. The
plateau height was calculated relative to the force baseline before the
R phase. AFM traces demonstrating consistency of the triphasic RPE
response across multiple trials are shown in Figure 3. Histograms
showing the plateau force (C) and plateau length (D) distributions (pH
7.4 and calcium concentration of 2.5 mM.) Black lines in each
histogram are moving averages. (E) Force extension curve for the
linear polymeric fibrin strands (protofibrils) showing a blunted
`sawtooth' pattern of four triphasic coiled-coil signatures exhibiting
hysteresis (extension in red and relaxation in blue). The
AFM data reveal a characteristic force plateau related to the unfolding
of the fibrinogen's coiled-coils.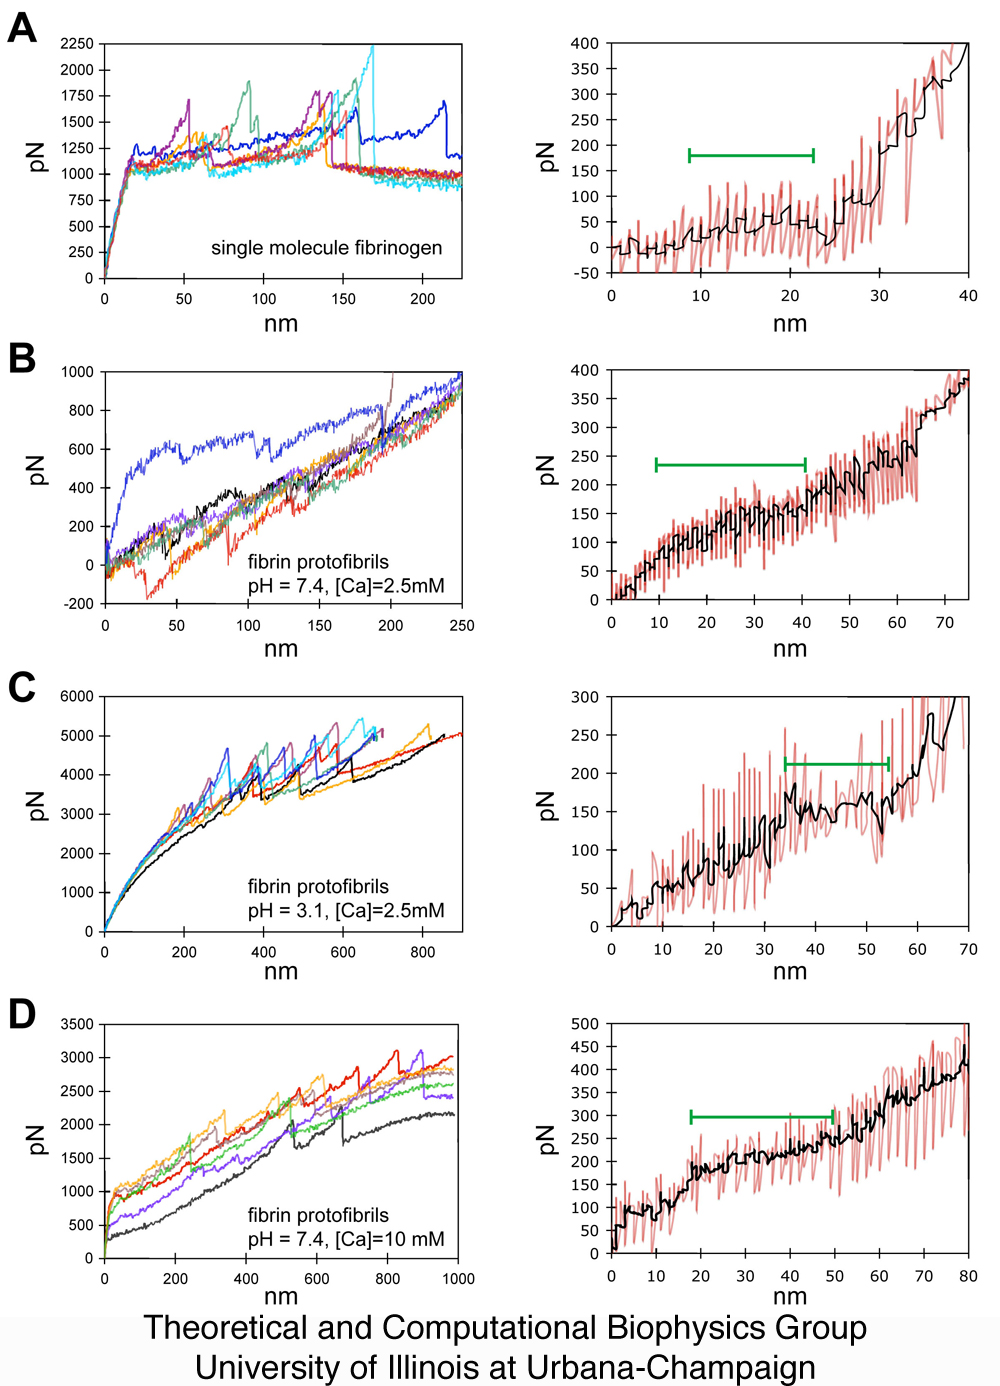
In a second set of AFM experiments, we stretched fibrin
protofibrils. In protofibrils the D and E
regions form a trimodular complex (Figures 1B, C) that is strengthened
by factor XIII crosslinking adjacent D regions. As
described above, such an arrangement makes unfolding of the D and E
regions highly unlikely, thereby leaving the coiled-coils as the main
stretchable element. Indeed, force-extension curves for
protofibrils show the same triphasic response as observed for single
fibrinogen molecules, but without the dip in force following the P
phase. The triphasic (RPE) response repeats itself in a blunted
sawtooth pattern (Figure 2E), the average plateau force for
protofibrils measuring 130 pN, and the average plateau length measuring
30 nm (Figure 4A). The increase of the plateau force over that of
single fibrinogen (60 pN) is consistent with protofibrils containing
two fibrinogens in parallel, i.e., one expects a doubling of the
extension force. The plateau length is close to the extension for two
sets of coiled-coils to be stretched out. One would expect
simultaneous unfolding of all coiled-coils in the protofibril producing
a single long plateau as opposed to a blunted sawtooth pattern;
however, there appears to be a mechanism at work that favors sequential
unfolding. We speculate that a unique structural feature of
fibrinogen may play a role in this mechanism. Specifically we implicate
a fourth helical strand at the C-terminus of each set of coiled-coils,
which connects with fibrinogen's a-chain C-terminal (α-C)
regions,
that lie parallel to the coiled-coils, and have been shown to interact
electrostatically with the distal portion of the fibrinogen coiled coil
regions. This interaction may buffer forces between connected
fibrinogen molecules and restrict unfolding at any one time to
the length of a single fibrinogen molecule.
Figure 3.
Multiple AFM force extension curves
and corresponding average triphasic response. In the first
column, seven representative force extension curves are shown for each
of the different conditions examined: (A) single fibrinogen molecules
at physiological pH and calcium concentration, (B) fibrin protofibrils
at physiological pH and calcium concentration, (C) fibrin protofibrils
at low pH, and (D) fibrin protofibrils at high calcium
concentration. In the second column are shown the RPE responses
(in red) aligned and averaged (in black) over multiple AFM trials where
such triphasic curves are seen, demonstrating a consistency in
reproducing plateau heights and lengths as shown in Figures 2 and
4. The P phase is denoted by the green bar.
Molecular Dynamics Simulations of Fibrinogen
 In order to relate the AFM data
unambiguously to fibrinogen
stretching, we performed molecular dynamics (MD) simulations. The
simulations, which stretched fibrinogen in the same manner as expected
in our AFM experiments, reproduced indeed the force-extension curves
seen in the AFM experiments in remarkable detail (Figure 4A)
albeit at higher forces due to the simulations' higher stretching
velocities.
In order to relate the AFM data
unambiguously to fibrinogen
stretching, we performed molecular dynamics (MD) simulations. The
simulations, which stretched fibrinogen in the same manner as expected
in our AFM experiments, reproduced indeed the force-extension curves
seen in the AFM experiments in remarkable detail (Figure 4A)
albeit at higher forces due to the simulations' higher stretching
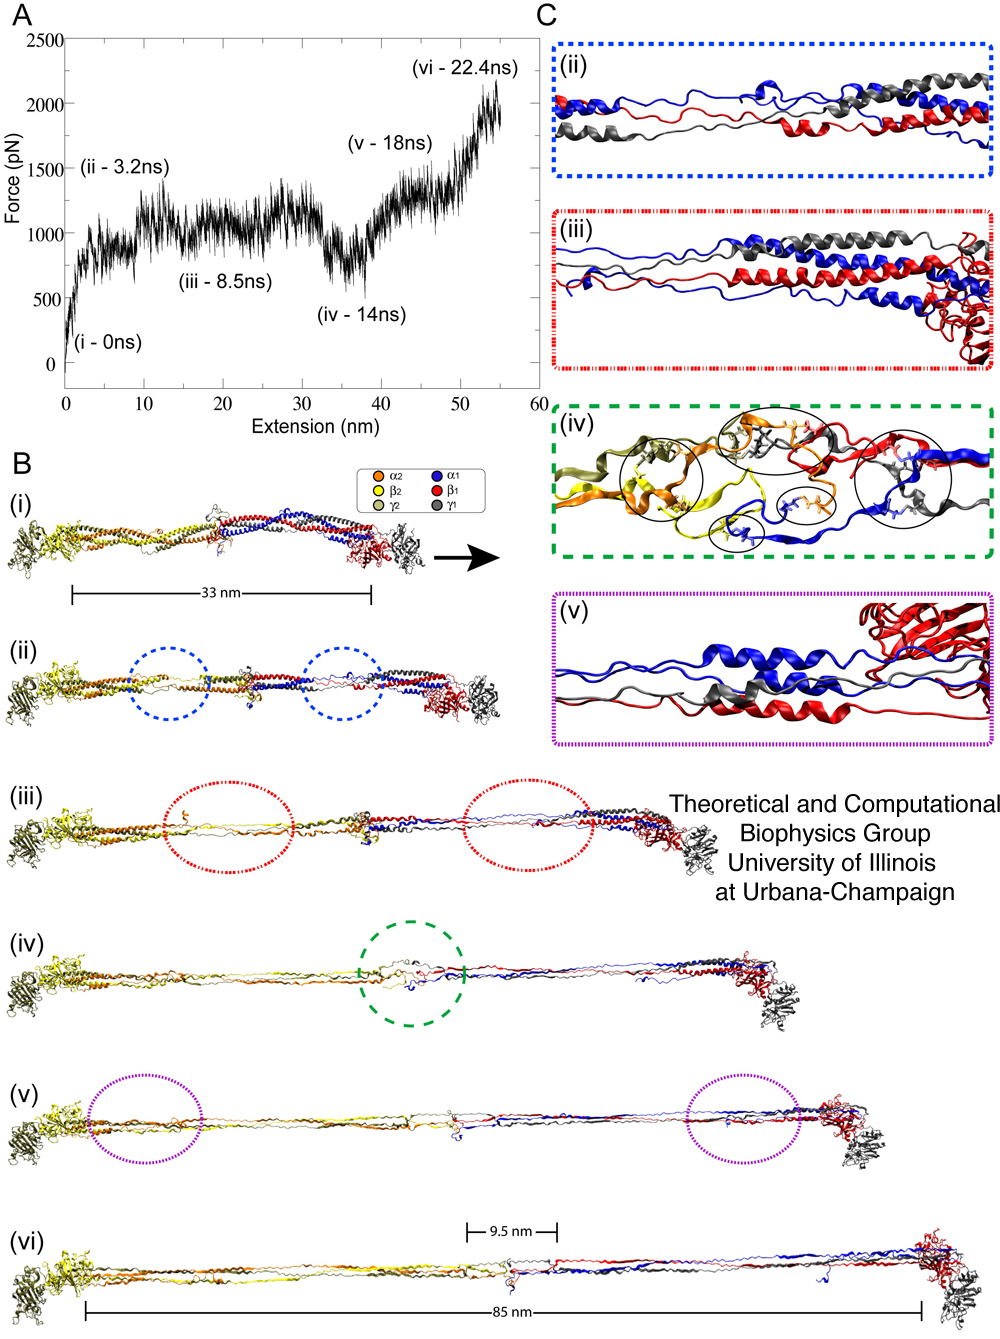
velocities. Whole fibrinogen, consisting of two sets of α-ß-γ coiled-coil helices, was stretched at a velocity of 0.025 Å/ps until both sets of helical domains were fully extended. The resulting force-extension profile, shown in Figure 4A, reproduces the triphasic `RPE' response observed in the AFM force-extension trace (Figure 2B and 3A). This close agreement is clear evidence that isolated coiled-coils are indeed being stretched in our AFM experiments. In addition, the simulations revealed that, as the fibrinogen molecule is stretched, the extension occurs in a specific and orderly pattern, with distinct regions within the coiled-coil unraveling before others. Specifically the first region to unfold is the double α-helix region (comprising the α- and ß-chains) near the center of the helical domain (Figure 4A,ii). This is followed by unfolding of the triple α-helix regions (comprising all three chains, see Figure 4A,iii) that flank both ends of the double α-helix region. When the triple α-helix region is fully extended, the central domain (or E region, Figure 4A,iv) of fibrinogen unfolds despite the presence of disulfide bonds, which were not disrupted. Finally, the remaining helical region, consisting of a four α-helix bundle (see Figure 4A,v) at the C-terminal, unravels to complete extension (approximately 21 nm on each side) of the coiled-coil helix fibrinogen domain. This measured extension is slightly larger than the plateau length value observed from the AFM measurements (15 nm). Thus, in much the same way as a rope with more coiled strands can bear a higher mechanical load, the architecture of fibrinogen's successively coiled α-helical regions lend to it an increasingly stiff response to pulling forces, such that the double α-helices unravel first, followed by unraveling of the triple helices and finally of the C-terminal four α-helix domain. Simulations of half of a fibrinogen molecule, in which one set of coiled-coil helices (α1/ß1/γ1) was stretched at velocities of 0.05 Å/ps and 0.025 Å/ps, also revealed a triphasic (RPE) force extension curve, however, the curve not exhibiting the pronounced dip seen for whole fibrinogen as is to be expected. This demonstrates clearly that the dip stems from unfolding of the central domain, not included in half fibrinogen.
Figure 4. Stretching fibrinogen using steered molecular dynamics simulations. (A) Force-extension profile of fibrinogen stretched at 0.025 Å/ps over the course of simulation simB2 (see Table 1). The marked time points along the trace denote unfolding events highlighted in (B) and (C). (B) Snapshots of unfolding events show (i) the initial equilibrated fibrinogen molecule before stretching at t=0 ns; (ii) unfolding of fibrinogen's double helical region at t=3.2 ns (blue circles); (iii) unfolding of fibrinogen's triple helical region at t=8.5 ns (red circles); (iv) unraveling of fibrinogen's central domain at t=14 ns (green circle); (v) unfolding of the terminal regions made of four helices at t=18 ns (purple circles); (vi) full extension of the coiled-coil segments of fibrinogen at t=22.4 ns. (C) Detailed views of unfolding events in (ii)- (v) corresponding to a partially unraveled helical or central domain region. Disulfide bonds are highlighted through circles in (iv). Unfolding of coiled-coils results in a force plateau, while unraveling and unfolding of the central region gives rise to a "dip" (iv) in the force-extension profile. All snapshots show the protein in cartoon representation, with each subunit colored differently (water not shown for clarity).
The correlation of central domain unraveling and the dip in the force-extension curves recorded in both AFM experiments and SMD simulations provides strong evidence that during AFM stretching of fibrin protofibrils, the central domain does not unfold since the dip is not seen, i.e., the extension in protofibrils is restricted to the coiled-coil regions. Analysis of simB2 in which whole fibrinogen is stretched, reveals, that charge-charge and electrostatic interactions between the termini of coiled-coils at fibrinogen's central region and the loops of the region's ß-hairpins stabilize the central domain and protect it from unfolding. When fibrinogen is stretched, the central region experiences a continuous force, yet does not unravel until the adjacent helical domans are fully extended. This behavior is puzzling, but can be understood from an inspection of simulation simB2.
Two unfolding barriers play a role in protecting the central domain against unfolding before the central domain is fully extended in the P phase. The first barrier is mainly entropic and arises from the coiled-coils inserting into the central domain: only when these coiled-coils are completely unraveled can the central domain unfold, suggesting that complete coiled-coil unraveling leads to a narrow conduit in conformational space, the entropic barrier or "eye of the needle," passage through which triggers the stepwise unraveling of the central domain at the end of the P phase. The second barrier arises from an enthalpic contribution due to charge-charge interactions between the coiled-coils and the central domain's ß-hairpin loops; energy required to dislodge the ß-hairpins from the loops encircling the central domain also contributes to the enthalpic barrier. The dip in the force-extension curve arises after the crossing of the entropic and enthalpic barriers described, i.e. when the central domain unfolds very easily. The crossing of the entropic and enthalpic barriers, shown in Figure 5, coincides with breaking of the ß-hairpin/loop interaction described above.
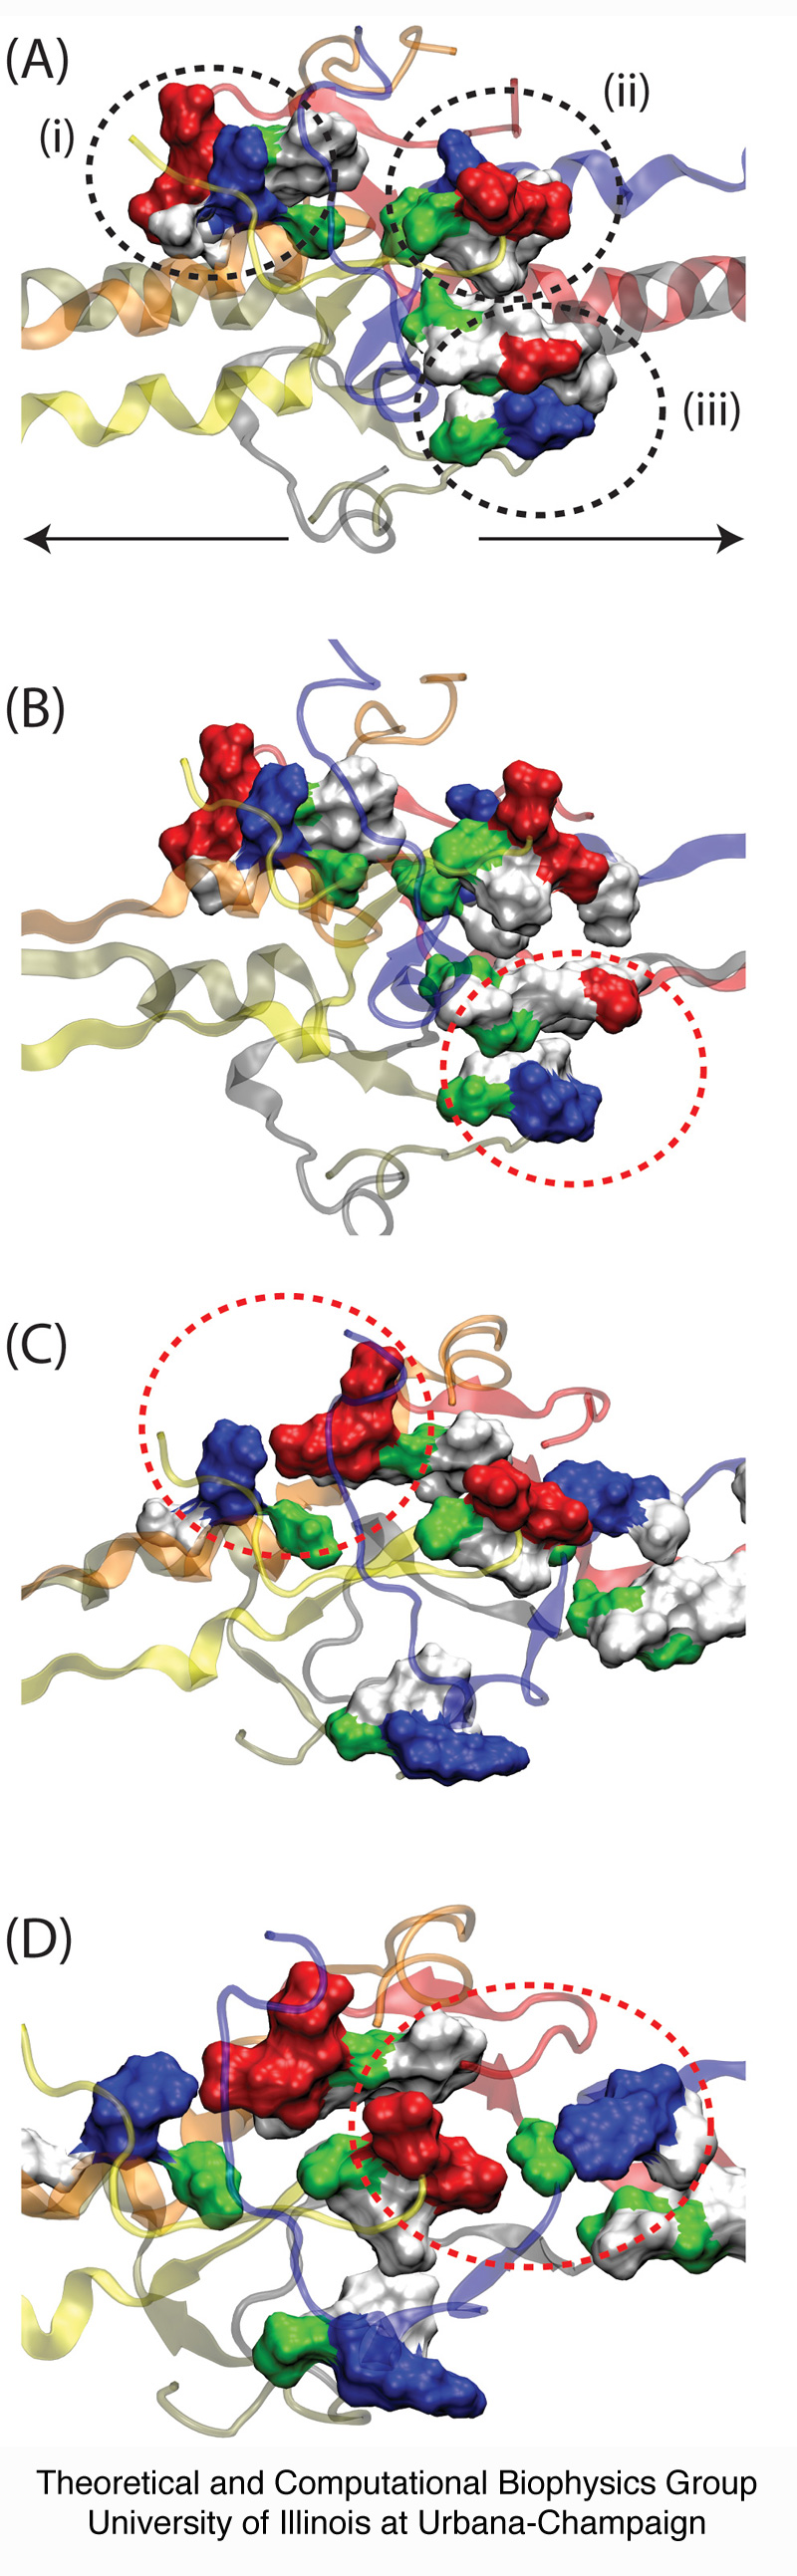
Figure 5. Rupture of contacts between fibrinogen's coiled-coils and its central domain. The coiled-coils from one half of fibrinogen interact with the loops of the b-hairpins from the opposing half of the molecule, stabilizing the central region and preventing it from unfolding. Shown in (A) are the contacts between (i) the terminal α-helix of chain D and ß-hairpin loop of chain B, (ii) the terminal α-helix of chain A and ß-hairpin loop of chain E, and (iii) the terminal α-helix of chain C and ß-hairpin loop of chain F. Residues are color coded as red (acidic), blue (basic), green (polar), and whtie (nonpolar). The direction of stretching is shown by arrows. As the helices stretch, charge-charge interactions as well as surface contacts are broken between the helices and ß-hairpins, permitting then the central region to unfold. These rupture events are shown in (B) for pair (iii), in (C) for pair (i), and in (D) for pair (ii).
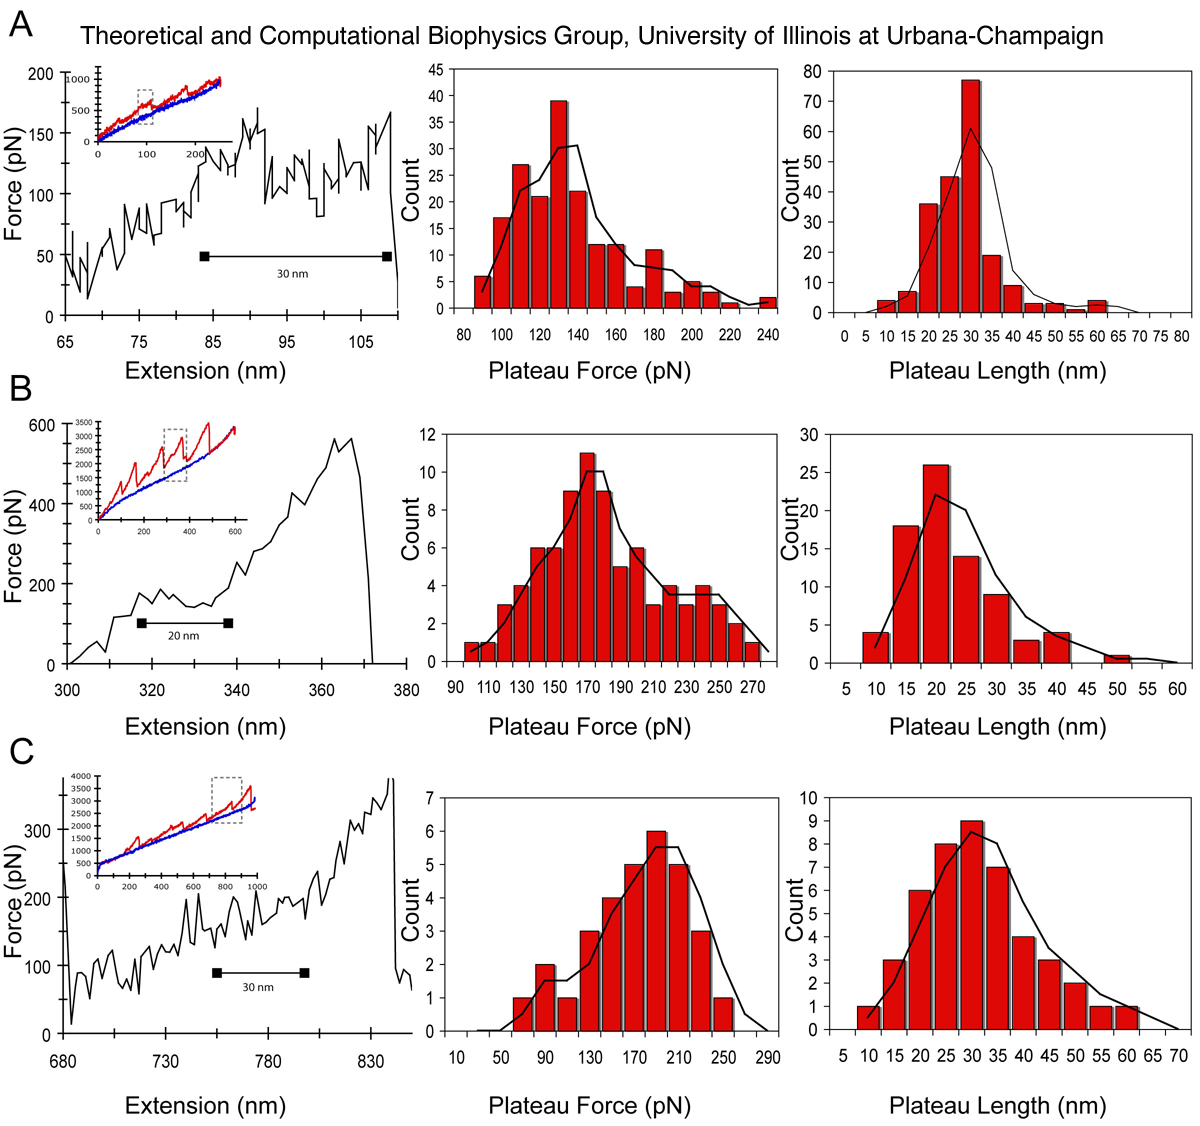
AFM Spectroscopy Under Different pH and Calcium Concentrations
 With the knowledge that
coiled-coils control fibrinogen's main elastic
response, one can naturally envision that factors modulating the
structural properties of the coiled-coils can render blood clots to be
either more stiff or more flexible. It is well known that local
pH and ion concentrations affect the mechanical properties of
coiled-coils. Therefore, additional AFM
experiments on protofibrils were performed to test these
conditions. At physiological pH (7.4) and calcium concentration
(2.5 mM) a plateau force of 130 pN and plateau length of 30 nm was
observed (Figure 6A). When the pH was lowered to 3.1, the average
plateau force increased to 170 pN and the average plateau length
decreased to 20 nm (Figure 6B). With increase in calcium
concentration from 2.5 mM to 10 mM (Figure 6, bottom), the average
plateau force increased to 190 pN, but the average plateau length
remained unchanged at 30 nm.
With the knowledge that
coiled-coils control fibrinogen's main elastic
response, one can naturally envision that factors modulating the
structural properties of the coiled-coils can render blood clots to be
either more stiff or more flexible. It is well known that local
pH and ion concentrations affect the mechanical properties of
coiled-coils. Therefore, additional AFM
experiments on protofibrils were performed to test these
conditions. At physiological pH (7.4) and calcium concentration
(2.5 mM) a plateau force of 130 pN and plateau length of 30 nm was
observed (Figure 6A). When the pH was lowered to 3.1, the average
plateau force increased to 170 pN and the average plateau length
decreased to 20 nm (Figure 6B). With increase in calcium
concentration from 2.5 mM to 10 mM (Figure 6, bottom), the average
plateau force increased to 190 pN, but the average plateau length
remained unchanged at 30 nm. The pH-dependent elastic response of fibrinogen may be due to charged interhelical interactions stemming from protonated residues. Calcium ions have been shown to coordinate intramolecular regions of proteins, thereby stiffening them against mechanical forces, a typical example being cadherin. Indeed, a calcium binding site has been reported between the coiled-coil and the ß-domain of fibrinogen that could be involved in an overall stiffening of fibrin protofibrils. The observed effects (Figure 6C) could also be due to putative calcium binding sites not yet identified. Further understanding and elucidation of the molecular mechanism underlying the effects of pH and calcium on modulating the elasticity of fibrinogen's coiled-coils offer avenues for future clinical therapy in blood clot management. For example, modulation of blood pH and administration of metal chelating agents may decrease the likelihood of thromboembolism for high risk patients.
Figure 6. Changes in coiled-coil plateau force and plateau length with changes in pH and calcium. (A) Representative force extension curve (left panel) for AFM stretching of fibrinogen protofibrils at physiological pH 7.4 and calcium concentration of 2.5mM. The inset in this and subsequent panels shows the raw force extension curve with an overall linear increase in force. The dashed rectangle denotes the region highlighted in the main plot. The middle and right panels show the plateau force and plateau length histograms. (B) Force extension curve and histograms for stretching protofibrils at pH 3.1. (C) Force extension curve and histograms for stretching protofibrils at a calcium concentration of 10 mM. The black line in the histograms is a moving average.
Conclusions
Our experimental-computational study demonstrates the presence of a force plateau when stretching fibrinogen, and relates the plateaus to an ordered, stepwise unfolding of the protein's coiled-coil domains. A triphasic (RPE) response to stretching seen in single molecules as well as in polymerized fibrin monomers should play a significant role in the mechanical response of fibrin to blood's shear forces that is critical to its biological function in maintaining the integrity of blood clots. Pharmacological intervention, targeting fibrinogen's coiled-coils to modulate fibrin clot elasticity may alter the risk for thromboembolism. Our approach emphasizes the power of a combined experimental-simulation approach to reveal structure-function relationships in cell biology and biomedicine.- Click here for a movie (mpeg, 8.1M) showing the extension of whole fibrinogen traced along its force-extension curve
- Click here
for a movie
(mpeg, 8.5M) showing the detailed unfolding events as whole fibrinogen
is stretched
- Click here for a movie (mpeg, 5.8M) showing the unraveling of the double helix regions of fibrinogen.
- Click here for a movie
(mpeg, 6.3M) showing the unraveling of the triple helix regions of
fibrinogen.
- Click here for a movie (mpeg, 5.1M) showing the architecture and unraveling of fibrinogen's central domain.
- Click here for a movie
(mpeg, 5.9M) showing the architecture and unraveling of fibrinogen's
central domain in surface view.
- Click here for a movie
(mpeg, 6.5M) showing the unraveling of the distal helices of fibrinogen.
- Click here for a movie (mpeg, 19.1M) showing the unraveling of the distal helices of fibrinogen in surface view.
Publications and Related Commentary on Fibrinogen and other Mechanical Proteins
Molecular Basis of Fibrin Clot Elasticity. Bernard Lim, Eric H. Lee, Marcos Sotomayor, and Klaus Schulten. Structure, 16: 449-459, 2008.
See also a related press article here and here about our work on fibrinogen (courtesy UIUC and ScienceDaily).
Investigators
- Eric H. Lee
- Bernard Lim (Mayo Clinic Department of Cardiovascular
Medicine)
- Marcos Sotomayor
- Klaus Schulten
Related TCB Group Projects
- Mechanical Proteins
- Mechanical Strength of the Z1Z2-Telethonin Complex
- The Chain
Like
Elasticity of Titin Z1Z2
Page created and maintained by Eric H. Lee.