Next: Analysis
Up: Basics of NAMD
Previous: Output: Water Sphere Log
Subsections
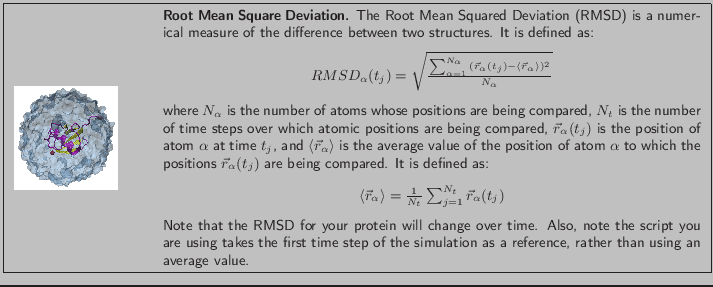
In this section, you will analyze the extent to which your system has equilibrated using what is known as the Root Mean Square Deviation, or RMSD. The RMSD characterizes the amount by which a given selection of your molecule deviates from a defined position in space. You will use the output files from your minimization and equilibration of ubiquitin in a water sphere to calculate RMSD values and analyze the extent of equilibration of the simulation. RMSD values will be calculated for all atoms of the protein backbone (without hydrogens) for the entire protein and for the protein excluding the last five residues.
Your minimization-equilibration simulation generated a trajectory for the system called ubq_ws_eq.dcd. That trajectory is key to calculating the RMSD of the protein over the course of the equilibration. The simulation was performed in a so-called NVT ensemble in which the number of particles, N, the volume, V, and the temperature, T, are kept constant.
VMD includes many analysis tools. One of these, the NAMD Plot plugin, may be used to plot output from NAMD log files. This VMD plugin uses the program namdplot, which gets the relevant data from the log files for values of energies, temperature, etc. over time. VMD then uses an internal plotting program to plot the data for you.
- 1
- Open VMD by typing vmd in the Terminal window.
- 2
- Launch the NAMD Plot plugin by clicking Extensions
 Analysis NAMD Plot in the VMD Main window.
- 3
- In the NAMD Plot window, select File Select NAMD Log File, select the file ubq_ws_eq.log and click Open.
- 4
- All the thermodynamic variables from the NAMD log file are available for plotting as shown in the VMD NAMD Plot window. TS stands for time step, BOND for bond energy, and so forth. Click the box marked TEMP and then select File Plot Selected Data. This will get all the temperature data from the log file and plot it over time.
- 5
- Try using NAMD Plot for TOTAL (total energy). You should see the variable converging to an average value for an equilibrated system.
The thermodynamic variables that you checked above tell you about the thermodynamic state of the whole system. But you would also like to know if your protein is conformationally stable. For this, you will calculate the RMSD of the protein backbone. This will give you an idea of the stability of the protein. If the RMSD is still increasing at the end of the run, it means your protein is still searching for a lower energy state, and thus is not yet equilibrated!
- 6
- When you are finished examining the plots, close the Multiplot window.
You will use VMD to calculate RMSD values:
- 7
- Load your psf file for the water sphere, ubq_ws.psf, which is in your common directory, by clicking File New Molecule... in the VMD Main window. Click the Browse button in the Molecule File Browser window. Find ubq_ws.psf in the common directory, and double click on it. Then click Load.
- 8
- Click the Browse button in the Molecule File Browser window. Click on the directory 1-2-sphere, and choose ubq_ws_eq.dcd by double clicking on it. Then click Load. You have loaded the trajectory of your equilibration.
- 9
- The script we are going to use is called rmsd.tcl. This is the script content:
| set outfile [open rmsd.dat w] |
|
| set nf [molinfo top get numframes] |
|
| set frame0 [atomselect top "protein and backbone and noh" frame 0] |
|
| set sel [atomselect top "protein and backbone and noh"] |
|
| # rmsd calculation loop |
|
| for { set i 1 } { $i <= $nf } { incr i } { |
|
| $sel frame $i |
| $sel move [measure fit $sel $frame0] |
| puts $outfile "[measure rmsd $sel $frame0]" |
|
|
| } |
|
close $outfile
|
|
- 10
- The script does the following:
- Open file rmsd.dat for writing.
set outfile [open rmsd.dat w]
|
|
- Get the number of frames in the trajectory and assign this value to the variable nf
set nf [molinfo top get numframes]
|
|
- Select the first frame of the molecule to be the one other frames will compare to. The selection contains the atoms in the backbone of the protein, excluding hydrogens:
set frame0 [atomselect top "protein and backbone and noh" frame 0]
|
|
- Make the same selection as before for an undetermined frame.
set sel [atomselect top "protein and backbone and noh"]
|
|
- Text after # denotes comment.
- Loop over all frames in the trajectory:
for { set i 1 } { $i <= $nf } { incr i } {
|
|
- Change the selection $sel to the frame to be compared.
- Calculate the matrix that will fit both selections. Apply this matrix to the second selection to align the molecules:
$sel move [measure fit $sel $frame0]
|
|
- Calculate the RMSD value between these two selections, and write it to file:
puts $outfile "[measure rmsd $sel $frame0]"
|
|
You can use the script for the system to test for equilibration.
- 11
- Open the TkCon window of VMD by clicking Extensions Tk Console in the VMD Main window. In the TkCon window, type source rmsd.tcl. This will perform all the commands in the script. The script will write a file rmsd.dat that will contain the value of the RMSD of the protein backbone against time.
Outside of VMD, you can use a plotting program to see this data. Examples of these are gnuplot, xmgrace, Microsoft Excel, Mathematica, and scilab.
- 12
- Use xmgrace to plot the file rmsd.dat. In the Terminal window, type xmgrace rmsd.dat.
The curve does not reveal very much information because of short runtime and infrequent writing of the dcd file. Figure 8 shows a more typical RMSD plot for an equilibrated system along with the plot you have generated. Can you see the first RMSD curve flattening? This means the system is equilibrated.
Figure 8:
RMSD versus simulation time for a system equilibrating with a longer run time (left) and your system (right)
![\begin{figure}\begin{center}
\par
\par
\latex{
\includegraphics[scale=0.5]{pictures/tut_unit01_rmsdunix}
}
\end{center}
\end{figure}](img69.png) |
The last five residues are relatively unstable compared to the rest of the protein. How do you think the RMSD should differ in this case than with the entire protein?
- 1
- You can easily modify the rmsd.tcl to plot the RMSD for the protein without the last five residues. Exit xmgrace by clicking File Exit in the program window. Create an identical file to rmsd.tcl with a new name by typing cp rmsd.tcl rmsd_5.tcl in the Terminal window.
- 2
- Open the new file rmsd_5.tcl using nedit by typing nedit rmsd_5.tcl in the Terminal window.
- 3
- Edit the file in the following way:
| Line 1: open rmsd.dat w |
|
open rmsd_5.dat w |
| Line 3: ...and noh" |
|
...and noh and not (resid 72 to 76)" |
| Line 4: ...and noh" |
|
...and noh and not (resid 72 to 76)" |
- 4
- Save the file and exit nedit by clicking File Save and then clicking File Exit.
- 5
- Type source rmsd_5.tcl in the TkCon window of VMD. This will perform all the commands in the script. The script will write a file rmsd_5.dat that will contain the value of the RMSD of the protein backbone against time without the last five residues.
- 6
- Use xmgrace to plot the file rmsd_5.dat in the same manner as before with file rmsd.dat.
- 7
- When you are done analyzing the plot, close xmgrace.
- 8
- Delete the current displayed molecule in VMD using the VMD Main window by clicking on ubq_ws.psf in the window, and selecting Molecule Delete Molecule.
Next: Analysis
Up: Basics of NAMD
Previous: Output: Water Sphere Log
namd@ks.uiuc.edu