From: koushik.k (koushik.k_at_students.iiit.ac.in)
Date: Wed Nov 16 2011 - 22:18:59 CST
Hi Parisa,
The .traj file is sufficient to do WHAM calculations. You just have to do
a bit of post-processing of .traj file. Remove the comments (lines
beginning with hash) in the file which occur after around 100000 steps.
>From the .traj file, the time and ion position columns are sufficient.
They should be "single space" separated. Download WHAM. You also have
proper documentation (tutorials) for WHAM which will help you in
generating PMFs.
However, before you can use WHAM, you have to look for sufficient overlap
between adjacent windows. To check if there is overlap between adjacent
windows, you have to plot histograms of the reaction coordinate for each
window. Plot all the histograms simultaneously and see if there is
sufficient overlap. If not, WHAM calculations will never converge. Xmgrace
tool should help you in plotting histograms. Or else, you can write simple
code which finds out the maximum and minimum values of reaction coordinate
for each window, divide the range into suitable bins (a typical bin size
is 0.1), count the number of samples which fall into a particular bin,
divide it by the total number of samples in all bins to get the
probability distribution of the reaction coordinate for that window. I am
not sure what the .dat file contains because i never used the histogram
part of colvars module. I guess it contains details regarding histogram.
However, I would suggest that you write a script of your own to generate
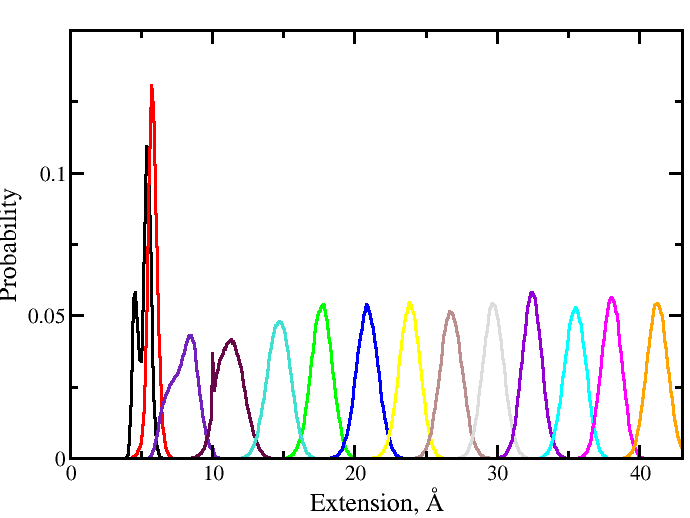
histograms. A sample histogram for 14 windows is attached which shows
overlap between adjacent windows.
Koushik Kasavajhala
Master of Science by Research in Bioinformatics
Center for Computational Natural Sciences and Bioinformatics (CCNSB)
International Institute of Information Technology, Hyderabad (IIIT-H)
India
> Dear NAMD experts,
>
> I am planning to use "umbrella sampling" method in NAMD to obtain the PMF
> profile for the ion movement along channel.I found a useful link posted on
> NAMD mailing list which suggests to use "histogram" method inside the
> colvars module:
>
> http://www.ks.uiuc.edu/Research/namd/mailing_list/namd-l/12631.html
>
> I have used "colvars" module before to run ABF simulations so I am
> familiar with it. I defined a "DistanceZ" colvar to move my ion along Z
> direction (dynamic axis) with respect to "rm". For the "umbrella sampling"
> part, I first defined a "harmonic" potential to keep the distance of ion
> fixed with respect to "rm". Then, I used "histogram" as below:
>
>
> harmonic {
> colvars AtomDistance
> centers 1.00
> forceConstant 10.0
> }
>
> histogram {
> colvars AtomDistance
> outputFreq 100
> }
>
> The only generated output files related to RC and force are ".traj" and
> ".dat". In the first one force and ion position along dynamic axis are
> reported during time and the only useful information from the second one
> is the number of samples in the bins. Is that what I am supposed to get?
> Are these output files enough to run "WHAM" or I am missing something
> here?
>
> Is there any other way to put the windows together and obtain PMF profile
> rather than using "WHAM"? And finally, is there any command to run the
> windows together using one "umbrella sampling" simulation? Unlike ABF, I
> could not find any specific tutorial in NAMD to run umbrella sampling. Is
> there a specific tutorial for it?
>
> Please let me know,
>
> Parisa
>
>
This archive was generated by hypermail 2.1.6 : Mon Dec 31 2012 - 23:20:59 CST