From: Tom Sisan (tbsisan_at_gmail.com)
Date: Wed Mar 30 2011 - 12:40:58 CDT
Hi Jim,
I ran each of your suggestions for 10ns. They all gave GPRESSAVG of between
7-8 atm.
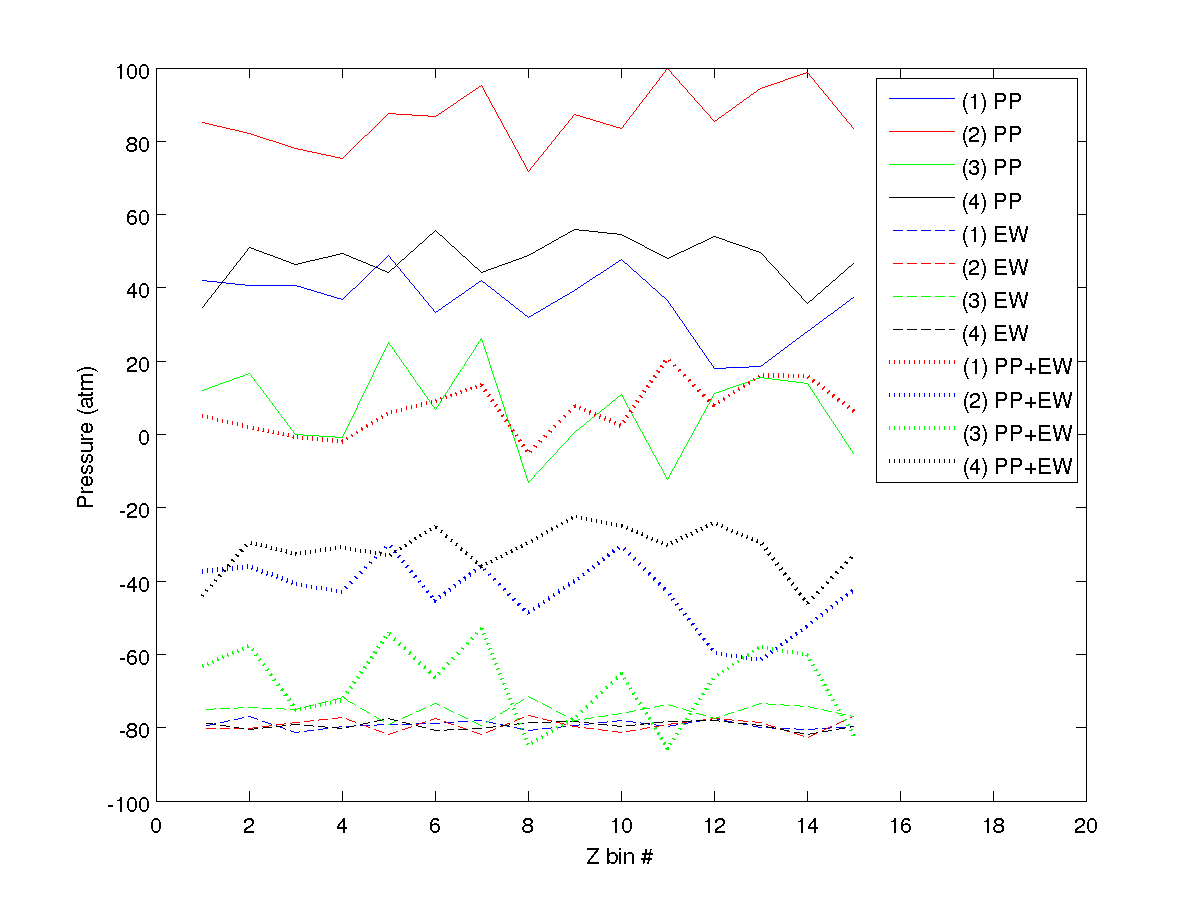
The pressure profile outputs varied with the settings you suggested. I
attached a figure showing the results. For this system size, the
simulations under the settings that I posted earlier (run 0) gave a
GPRESSAVG of 7.8atm and profiles of:
(0) pressure profile 50 atm. Ewald pressure profile -80atm. Total pressure
-30 atm
Your suggested tests gave:
(1) pressure profile 40 atm. Ewald pressure profile -80atm. Total pressure
-40 atm
(2) PP 87. EW -80. TP 7.
(3) PP 8. EW -80. TP -72.
(4) PP 50. EW -80. TP -30.
Test #2 was the only run with agreement between GPRESSAVG output and
PRESSUREPROFILE output, although test #3 also did (neglecting the ewald
contribution). Run 4 gave indistinguishable results from run 0, within
uncertainties.
I'm still a bit confused why GPRESSAVG is not the target pressure. Maybe it
is something I don't have set up right, or maybe it is a limitation of the
barostat for small systems. Also, is it normal to need a fullElectFrequency
of 1 to get accurate pressure profiles?
Thanks for the help,
Tom
On Sun, Mar 27, 2011 at 10:04 AM, Jim Phillips <jim_at_ks.uiuc.edu> wrote:
> Hi Tom,
>
> Could you try a few quick experiments for me?
>
> 1) Increase stepsPerCycle to 12 and fullelectfrequency to 3?
>
> 2) Lower fullelectfrequency to 1?
>
> 3) Turn off PME?
>
> 4) Lower langevinDamping to 1?
>
> -Jim
>
>
>
> On Thu, 24 Mar 2011, Tom Sisan wrote:
>
> Hi all,
>> I have started simulating boxes of water to try and understand pressure
>> control. The average output pressures of my simulations (the mean of
>> GPRESSAVG) are always too high. For a small system, for a target pressure
>> of 1 atm, the system pressure is consistently about 6 atm. Also, I have
>> noticed a trend where the smaller my box of water, the bigger the
>> deviation
>> between the target pressure (langevinPistonTarget) and the average of
>> GPRESSAVG. Is this behavior expected and understood?
>>
>> Also, I have not been able to get the output of the pressureProfile to
>> match
>> with the average of GPRESSAVG. It looked to me like it should just be a
>> matter of adding the PRESSUREPROFILE output with the ewald PRESSUREPROFILE
>> output calculated offline as shown in the example in the user guide. But
>> the ewald contribution is about -200atm for each bin along the
>> z-coordinate,
>> and the other contributions are about +100atm. I don't understand this
>> discrepency between the pressure profile and the global pressures
>> (GPRESSAVG).
>>
>> Thanks for any help, an example of my config file is below.
>> -Tom
>>
>> structure n233watermolecules.psf
>> coordinates n233watermolecules.pdb
>>
>> cellBasisVector1 20.0 0.0 0.0
>> cellBasisVector2 0.0 20.0 0.0
>> cellBasisVector3 0.0 0.0 20.0
>> cellOrigin 0.0 0.0 0.0
>>
>> wrapWater on
>>
>> exclude scaled1-4
>> 1-4scaling 1.0
>> cutoff 11.
>> switching on
>> switchdist 9.
>> pairlistdist 14.0
>>
>> timestep 2.0
>> rigidBonds water
>> nonbondedFreq 1
>> fullElectFrequency 2
>> stepspercycle 10
>>
>> PME yes
>> PMEGridSizeX 24
>> PMEGridSizeY 24
>> PMEGridSizeZ 24
>>
>> langevin on
>> langevinDamping 5
>> langevinTemp 300
>> langevinHydrogen no
>>
>> useGroupPressure yes
>> useFlexibleCell no
>> useConstantArea no
>> langevinPiston on
>> langevinPistonTarget 1.01325
>> langevinPistonPeriod 100.
>> langevinPistonDecay 50.
>> langevinPistonTemp 300
>>
>> run 2500000
>>
>>

This archive was generated by hypermail 2.1.6 : Mon Dec 31 2012 - 23:20:03 CST