The RamaPlot window displays a Ramachandran plot for a selected molecule. If you animate your molecule over a range of frames , RamaPlot will update the Ramachandran plot automatically. You can select a range of residues to be displayed in the plot. Clicking on a point in the Ramachandran plot will show the trajectory of the selected residue in Ramachandran space over all frames . Fields on the right of the window show the computed value of phi and psi for the most recently selected residue. Finally, you can create a PostScript image of the current Ramachandran plot. RamaPlot functionality is summarized in Fig. 4.14.
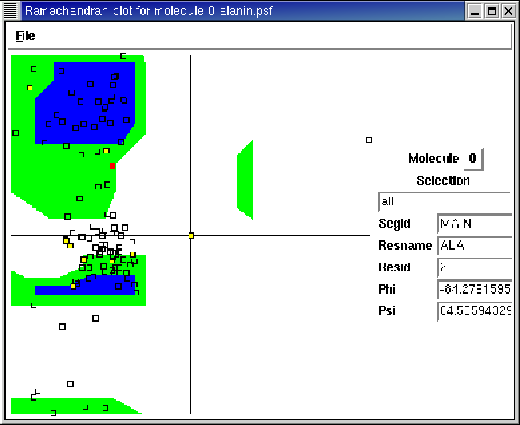
Start RamaPlot by typing ``ramaplot" in the VMD text console, or by selecting the ramaplot menu item in the Extensions menu. The main window contains a Ramachandran graph, with phi and psi running along the horizontal and vertical axis, respectively, from -180 to 180 degrees. The most allowed region of Ramachandran space is colored blue; partially allowed regions are colored green.
After loading a molecule, using the pulldown menu in the upper right part of the window to choose a molecule. Protein residues in the current molecule are mapped to the Ramachandran diagram with yellow squares. Clicking on a square causes the square to turn red, displays residue information in the fields on the right side of the window, and, if trajectory data is present, draws the location of the selected residue in Ramachandran space for all frames in the trajectory as empty black squares. Clicking one of the empty squares causes VMD to redraw the graphics display window with coordinates from the timestep corresponding to that square. Clicking a second time on a red highlighted residue switches off the trajectory information in the RamaPlot window.
When a protein contains many residues, it may be inconvenient to display all residues at once. Enter an atom selection in the Selection input to choose which residues to display. Note that the selection must contain the alpha carbons (name CA) of the residues you want to show. Note also that, just like the Graphics form, the selection will not be recomputed if you change the animation frame.
To print the contents of the white Ramachandran plot, select ``Print to file..." from the RamaPlot File pulldown menu. Enter a filename to save the contents of the window.