From: Roshan Shrestha (roshanpra_at_gmail.com)
Date: Wed Oct 05 2016 - 11:07:09 CDT
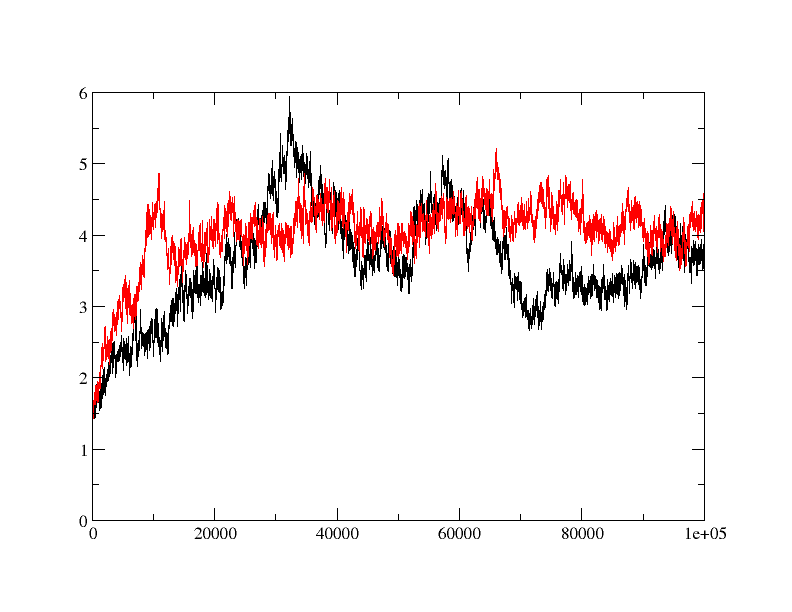
Don't worry dhiraj, it's obviously rmsd in Y-axis and Time steps in X-axis.
Shouldn't have been any fuss with it !!!
On Wed, Oct 5, 2016 at 9:48 PM, <dhirajks_at_gmail.com> wrote:
> Sorry. I should have labeled it. Y axis is time in picosecond and x axis
> is rmsd in Angstrom.
>
> Dhiraj
>
> Sent from my iPhone
>
> On Oct 5, 2016, at 10:55 AM, Pardis Tabaee <pardis.tabaee.d_at_hotmail.co.uk>
> wrote:
>
> Hi,
>
>
> What's on the y axis?
>
>
> Regards,
>
>
> P
>
>
> ------------------------------
> *From:* owner-namd-l_at_ks.uiuc.edu <owner-namd-l_at_ks.uiuc.edu> on behalf of
> Dhiraj Srivastava <dhirajks_at_gmail.com>
> *Sent:* 04 October 2016 22:07
> *To:* namd-l_at_ks.uiuc.edu
> *Subject:* namd-l: question regarding rmsd
>
> Hi
> I am trying to do MD simulation on a protein with and without ligand.
> when I did rmsd plot, I found that apo protein is behaving fine (red) but
> ligand bound form (black) is taking relatively longer time to equilibrate
> and showing quite a bit of fluctuation in rmsd. is the fluctuation in rmsd
> value for ligand bound protein is acceptable or is there anything wrong?
> How can I fix it?
>
> thanks
> Dhiraj
>
>
> [image: Inline image 3]
>
>
--
Roshan Shrestha
Graduate Student
Central Department of Physics,Tribhuvan University
Kathmandu,Nepal
This archive was generated by hypermail 2.1.6 : Sun Dec 31 2017 - 23:20:44 CST