You can use the mouse to manipulate the structure in the display window. There are three basic mouse modes: rotation, translation, and scaling. The mode can be changed from the Mouse menu in the main form, or by pressing r, t, or s on the keyboard while the mouse is in the graphics window. While experimenting, note how the cursor changes to indicate the mouse mode. In rotation mode, the left mouse button controls rotation about axes parallel to the screen, and the middle button controls rotation about the axis perpendicular to the screen. In translation mode, the left mouse button controls translation parallel to the screen, while the middle button controls translation in and out of the screen. Finally, in scaling mode, both the left and middle buttons control global scaling when the mouse is moved left or right, but the middle button causes larger changes.
By default molecules are displayed in a ``lines'' representation,
colored by atom type.
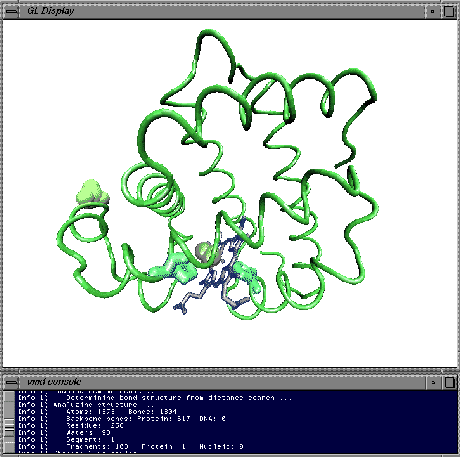
Suppose you would like to view the myoglobin structure with its
protein backbone represented as a tube, the heme represented as
licorice, the ![]() ion and
ion and ![]() molecule represented as van der
Waals spheres, and histidines 64 and 93 represented as CPK
models.
First, open the
Graphics form
by selecting the Representations item in the the graphics menu
of the VMD main form.
Type backbone in the Selected Atoms text entry
area and press 'enter' to select the myoglobin backbone. All of the
protein except for the backbone will disappear.
Choose Tube in the drawing method chooser to display the backbone
as a tube, and choose Backbone in the coloring method chooser
to color the tube with the predefined backbone color.
Press the Create Rep button. This creates a new representation
in the browser, identical to the original one. The new representation
can be changed without affecting others, so clear the atom selection
text area and enter resname HEM to select the heme. At this point
the heme isn't visible because it cannot be drawn as a tube, so choose
the `Licorice' drawing method
to make it appear. Click on Create
New again to make a new view, and enter resname SO4 CO to
select the
molecule represented as van der
Waals spheres, and histidines 64 and 93 represented as CPK
models.
First, open the
Graphics form
by selecting the Representations item in the the graphics menu
of the VMD main form.
Type backbone in the Selected Atoms text entry
area and press 'enter' to select the myoglobin backbone. All of the
protein except for the backbone will disappear.
Choose Tube in the drawing method chooser to display the backbone
as a tube, and choose Backbone in the coloring method chooser
to color the tube with the predefined backbone color.
Press the Create Rep button. This creates a new representation
in the browser, identical to the original one. The new representation
can be changed without affecting others, so clear the atom selection
text area and enter resname HEM to select the heme. At this point
the heme isn't visible because it cannot be drawn as a tube, so choose
the `Licorice' drawing method
to make it appear. Click on Create
New again to make a new view, and enter resname SO4 CO to
select the ![]() ion and the
ion and the ![]() molecule, and choose the drawing
method `VDW' to render them as Van der Waal spheres. Once again,
press the Create Rep button and enter resid 93 64 to
select the two histidines, and render them as `CPK'.
If you followed all that, then congratulations, you have made a nice
image of myoglobin! With further experimentation you should be
well on your way to learning how to use VMD.
molecule, and choose the drawing
method `VDW' to render them as Van der Waal spheres. Once again,
press the Create Rep button and enter resid 93 64 to
select the two histidines, and render them as `CPK'.
If you followed all that, then congratulations, you have made a nice
image of myoglobin! With further experimentation you should be
well on your way to learning how to use VMD.