Several of the coloring methods, including `Beta', `Charge', and `Occupancy', describe a range of floating point values rather than a set of names. These are colored via the color scale, which is a list of 32 smoothly changing colors. There are many color gradations available. All of them consist of transformations of three colors. For instance, ``RGB'' colors the smallest value red, values near the middle of the scale are green, and the largest values are blue. Colors in-between are linear mixes of the two colors. The list of available gradations is given below.
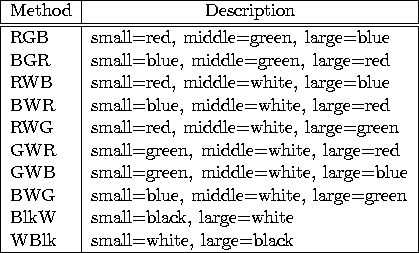
Table 6.3: Available Color Scale Gradations.
The minimum of the range of values is linearly scaled and shifted to start at 0 and end at 1. Assume the color scale is RGB. For a given value of x in the scale range [0..1], the RGB value is found first from a linear scaling based on the midpoint. If x = 0, R is 1 (for maximum red). This continues linearly until x = midpoint, at which point, R is 0 and stays 0. The green component is 0 at both x = 0 and x = 1 and is 1 at the midpoint. Linear scaling occurs in between. The blue component is 0 for x <= midpoint, and 1 for x = 1.
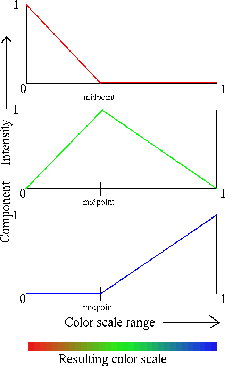
Figure 6.1: RGB color scale: the three plots shows the
contributions of each color, and the resulting colors are on the bottom.
An additional term, ``min'', is added to each of the component terms before they are merged. This shifts the final colors more towards white or black. Min can take on values from -1 to 1.
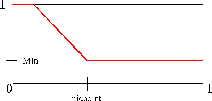
Figure 6.2: The shift to the red component of the RGB
scale caused by the value of ``min''.
There is only one color scale used at a time so it is impossible to display objects colored by multiple different color scales.