
From: Francesco Pietra (chiendarret_at_gmail.com)
Date: Tue Apr 24 2018 - 08:51:02 CDT
Hi Brian:
FEP for the Unbound ligand
frwd 0.00 0.20 0.05
back 0.20 0.00 -0.05
preeq 1ns
FEP 6ns
outputenergies, outputtiming, outputpressure, restartfreq, XSTFreq,
dcdFreq, alchOutFreq 2ps
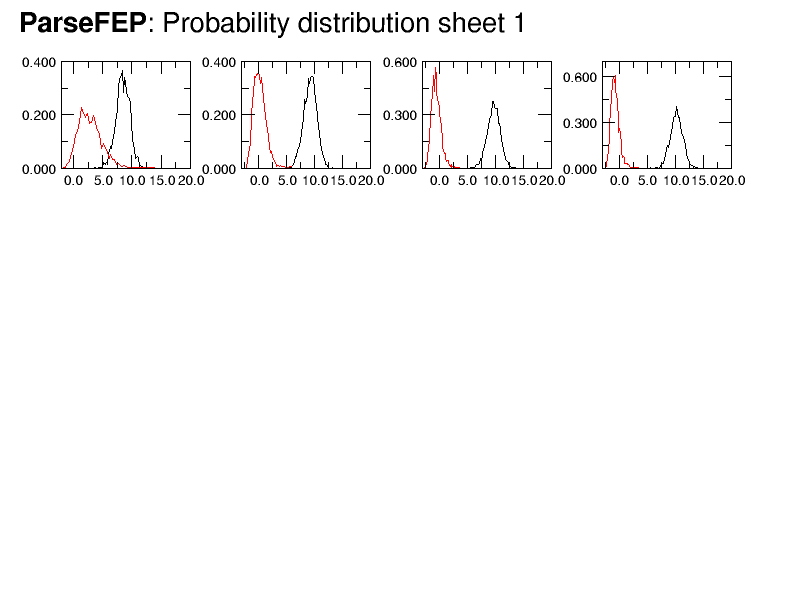
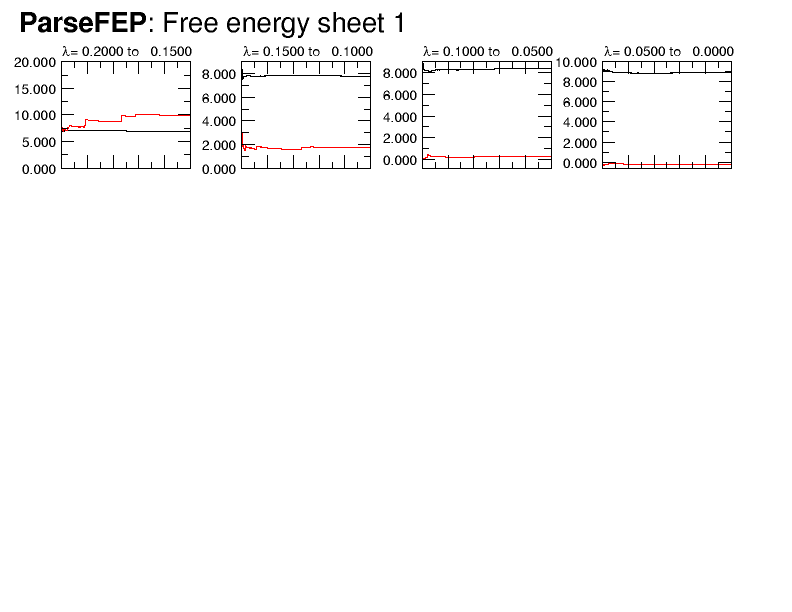
gave attached Probability distribution and Free energy sheets. Still not as
good as shown for the plugin but (in my view) as an acceptable compromise
for the steep region of the Hamiltonian. Should you disagree with my
cautious optimism, this FEP should be restarted with either a smaller
lambda or longer preeq/FEP. The latter will find problems of walltime, as
this FEP does not scale beyond one node. A smaller lambda requires breaking
the steep region in at least two parts, in this case allowing preeq 1ns,
FEP 6ns..
thanks for advice
francesco
On Mon, Apr 23, 2018 at 2:34 PM, Brian Radak <brian.radak_at_gmail.com> wrote:
> Hi Francesco,
>
> Based on our previous exchanges, I think what you in fact want is:
>
> frwd 0.00 0.20 0.05
> back 0.20 0.00 -0.05
>
> Since that is the region you want to overlap on (i.e. that region where
> soft-core effects are dominant).
>
> One very strong determinant of performance is the IO frequency -
> outputEnergies, DCDFreq, and alchOutFreq. I've never been very partial to
> the default value alchOutFreq (50 I think?) which seems incredibly low to
> me. I would choose something closer to 1-10 ps. although I can't promise
> that this would work perfectly for your application. If you don't actually
> want the full trajectories, then it is a waste time, effort, and space to
> save the DCD so you can safely make this rather high (or turn it off
> completely by setting it to zero). Hopefully those changes will boost
> performance.
>
> HTH,
> BKR
>
>
> On Sat, Apr 21, 2018 at 11:34 AM, Francesco Pietra <chiendarret_at_gmail.com>
> wrote:
>
>> Hello
>> I am carrying out a FEP for ligand Unbound
>>
>> frwd 0.00 0.20 0.05
>>
>> back 1.00 0.80 -0.05
>>
>>
>> preeq 1,000,000
>> FEP 6,000,000
>>
>> frwd was run at 0.002s/step performance throughout, and completed
>> according to expectations.
>>
>> back also stated at 0.002s/step but changed to 0.005 at step 4,038,000 of
>> the first window, and remained at this slow performance, until it was
>> killed by wall time limit.
>>
>> Question: is any code reason for that slow down, or, likely, a
>> filesystem problem? I must say that I have already noticed similar slowdown
>> of this NextScale during FEP (on a single node!).
>>
>> Thanks for advice
>>
>> francesco pietra
>>
>
>


This archive was generated by hypermail 2.1.6 : Tue Dec 31 2019 - 23:19:51 CST